


 310
310 Like
Like Share
Share
 Report
Author Note
All content, including samples, images and writings can be found in my GitHub repo: aliyoussefi/MonitoringPowerPlatform: This repo is designed to document and provide guidance on Monitoring with the Power Platform (github.com)
Revisions
02/10/2023 - Fixed images, updated titles and added YouTube video
Summary
More and more organizations across the world are embracing and investing in cloud based resources. Historically, with self-hosted Microsoft Dynamics CRM services, we could easily implement a monitoring approach. However, with this ease, came the issue of having dispersed or periodically captured logs, leading to a fragmented view of an environment. Also, this did not address business or transactional operations happening within the environment. Since then, features have been added to help expose data related to these workloads.
Staying up to date on organization health is key to all online deployments within the Microsoft Dynamics 365 ecosphere. This is not limited to the platform itself but to the key components used to authenticate, to provide business continuity and to broker messages and data. Azure and the Office 365 product families allow for continuous monitoring of Dynamics 365 and the Power Platform to keep businesses and organizations as healthy as possible.
This series will focus on how to implement a monitoring approach within, not only Dynamics 365, but also the Power Platform and exploring how to present a complete picture. From transactional workloads for first party applications, such as Power Automate and Power Apps, to visualizing all up environment analytics, monitoring deployments with Azure DevOps or GitHub Actions; I'll give my thoughts and experience on each.
What do we mean by Continuous Monitoring
Continuous Monitoring is the concept of procuring a collection of data to better understand the performance, health and other high value data points. Most of the applications we use in our personal lives collect data to better understand our patterns, trends, likes and dislikes. This data collection helps enhance the apps we use to assist, deliver and communicate helpful information to make us more productive and efficient.
In the business world, these same patterns and trends collected from Application Platform Monitoring tools can be used to proactively monitor and alert our Information Technology teams to better understand the connected platforms we use. Continuous Monitoring is imperative in our digital transformation as a business to understand where we improve our processes, detect anomalies and better serve our customers.
"Monitoring applications to detect and respond to problems - before an end user is even aware that a problem exists - is a common systems requirement, especially for revenue-generating production environments.." - Alexandre Polozoff 2003
A good and very detailed article from Alexandre explains the justification for Application Platform Monitoring. Justifications for application monitoring are provided as well as considerations for quality logging.
For this series, we will be utilizing Microsoft's tooling for capturing data in a centralized data store, consisting of Azure Application Insights and Azure Log Analytics. While there are many monitoring tools out there for practically every workload, for the Power Platform and connected Azure resources, we will use what allows us native integration to begin collecting data points. In the following sections, I'll cover what Application Insights and Log Analytics are and touch on what can be collected.
What is Application Insights
Application Insights is an extensible Application Performance Management (APM) service that can be used to monitor applications, tests, etc. Source: Application Insights Overview Application Insights can be used with any application hosted in any environment. Depending on what's being monitored there are SDKs available. For other applications connections and message delivery can be programmed using the REST APIs available.
For Power Platform components, Application Insights is recommended due to its direct integration with Power Apps features and tools and its capabilities to deliver to the API. I'll cover this in detail later, but for now be aware of the capability to incorporate Application Insights with the Power Platform.
Once we begin sending telemetry to Application Insights, we can review in real-time availability tests, user actions, deployment metrics as well as other feedback from our applications. Connecting our messages with correlation identifiers allows us a holistic view into how our apps are interdependent upon each other. This provides the transparency desired and honestly needed with modern era technology.
What is Log Analytics
Log Analytics is an OMS tool that is useful for monitoring CPU utilization, throughput, memory usage, etc for infrastructure insights. By collecting and analyzing these data points in real time we can manage high volume or long running processes to determine where we may need to scale or throttle. Activity and audit logging can supplement threat protection algorithms that protect our systems and the data that serves them.
What is Azure Data Explorer
Azure Data Explorer is the analytical data service used for the Azure Monitor platform which encompasses Application Insights and Log Analytics. With the ability to ingest data directly from multiple sources, as well as query across both log stores using the proxy cluster, this service will serve as our query engine going forward. Also of note, Azure Data Explorer can be used to query data within Data Lake Gen2!
What can be collected and extracted
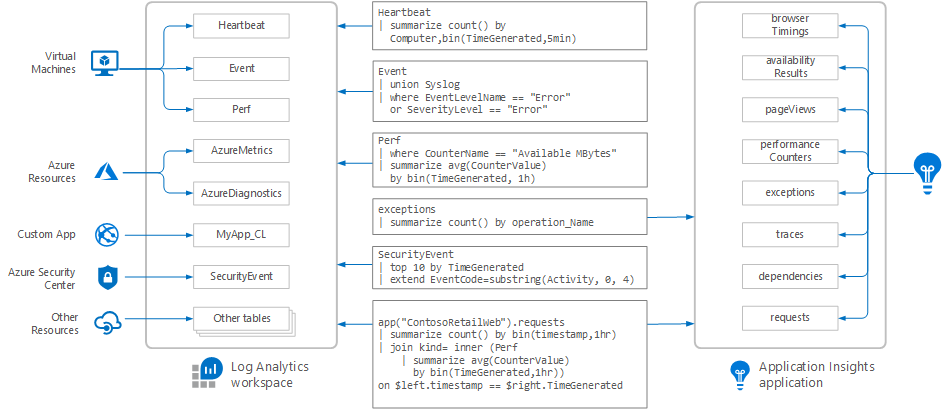
NOTE: Click to expand image
Any known data point can be collected and stored using Application Insights and Log Analytics. For applications, we can capture integration traffic, performance instrumentation, exception tracking and user activity to provide a panoptic view of all of our resources both in the cloud and workloads still hosted in on premise data centers.
As pointed out above, Application Insights and Log Analytics can be utilized for on-premise, the cloud or hybrid workloads. SDKs and Agents exist to help funnel this information to our log store for analysis by automation software. However, what is collected is only useful if we extract and analyze, which helps us determine gaps in our monitoring strategy. By continuously monitoring what is collected, we can close the gaps and enrich our monitoring strategy for the foreseeable future. Without it we are simply pushing data and incurring costs with little in return.
Next Steps
For Power Platform workloads, Application Insights provides robust features within most services, allowing for a straight-forward approach for incorporation. The purpose of this document will focus on how to implement a monitoring strategy for transactional operations as well as operational health across the Power Platform and connected resources, using these native features. In the case where a monitoring solution doesn't exist, we will explore documented features to help deliver messages.
The following chapters will cover the Power Apps Model-driven, Canvas and Portal apps, Power Automate, Power BI and more recent intelligence offerings, such as Power Virtual Agent and AI Builder across the Power Platform. The goal is to source and enrich messaging to a centralized area for analysis to assist and educate on usage and health. Like the Power Platform, applications and features are being added all the time; so this document represents a point in time reference and should be considered a work always in progress.
If you are interested in learning more about specialized guidance and training for monitoring the power platform, please contact your Customer Success Account Manager or Microsoft representative for further details. Your feedback is extremely valuable so please leave a comment below and i'll be happy to help where I can!

*This post is locked for comments