


 4,009
4,009 Like
Like Share
Share
 Report
Problem Statement:
While building customization for Microsoft Dynamics NAV / Business Central ERP, at times the customization is so heavy that we as developers do not realize how much load we put on the SQL Database which the backbone of the system.
One example of this situation is, I had built a system that can create a Cash Receipt during accepting Payment in terms of Cash from the Customer by temporary passing an entry through the Cash Receipt Journal. There was also a Payment Application code that applied(reconciled) the Payments and the Invoices of the Customer that ran posting of any financial entry concerning that specific Customer.
During this attempt of creating Cash Receipt, the posting would block the Customer, Customer Ledger Entries and G/L Entries Tables which was as per design. And it wouldn't allow anyone to make an entry during this period and it would take approximately 20-30 seconds.
To get out of the Deadlock, I was forced to restart the NAV Server Instance through Power Shell.
Introduction:
In this blog, I will mention how SQL Profiler helped me realize that the Cash Receipt Posting was taking way more resources than expected. There was no metric to even judge what was going on and which query tool precisely how much amount of time to execute.This also helped me change the process to follow to post Customer Cash Receipts.
Pre-requisites:
- Microsoft Dynamics NAV / Business Central On-Premise
- Microsoft SQL Server Management Studio
- Microsoft SQL Server
- Understanding of SQL Profiler
Books & References:
https://docs.microsoft.com/en-us/sql/tools/sql-server-profiler/sql-server-profiler?view=sql-server-ver15Demonstration:
1. Open NAV on one side of the screen:Goto Sessions in NAV search, select the session you want to use SQL Profiler and Start Full SQL Tracing.
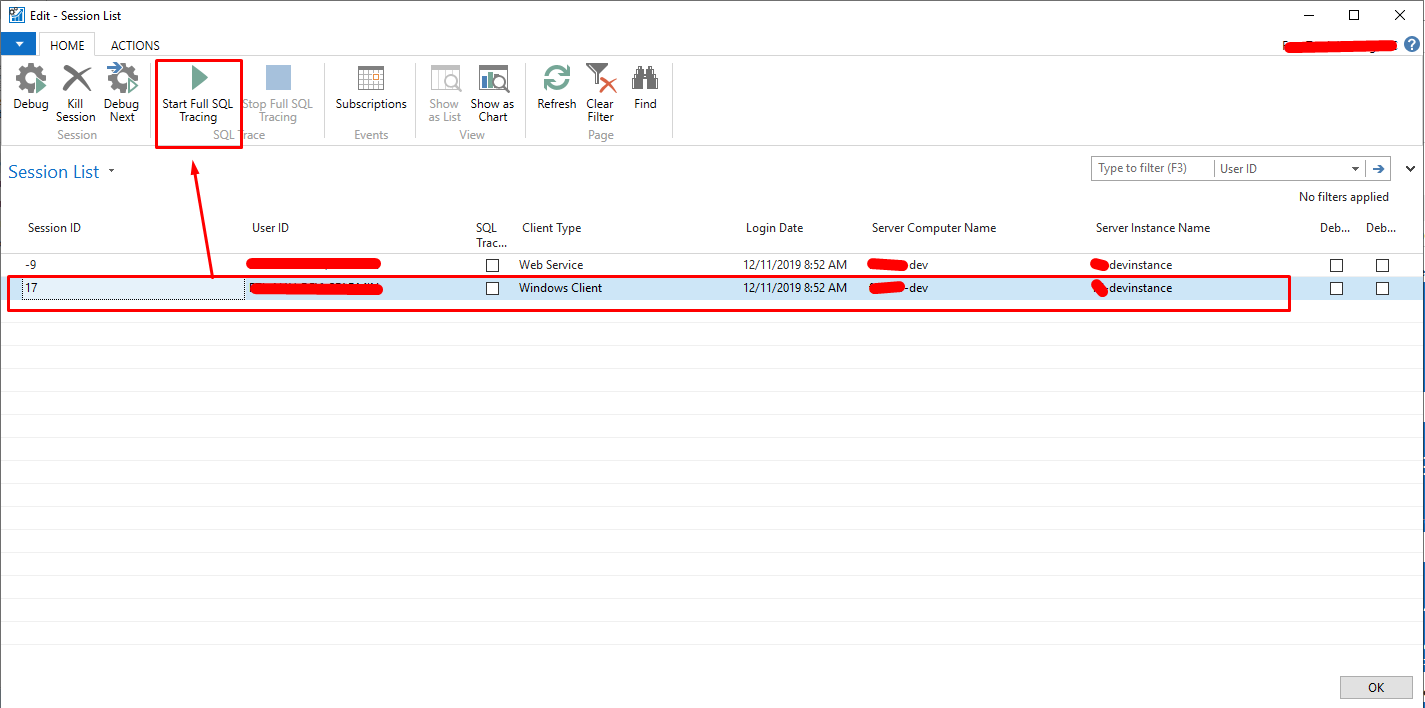 |
| NAV Sessions - Enable Full SQL Tracing |
2. Open SQL Profiler on the other side of the screen:
Goto SQL Server Management Studio > Tools > SQL Profiler
 |
| SQL Server Profiler |
 |
| SQL Server Profiler - Login |
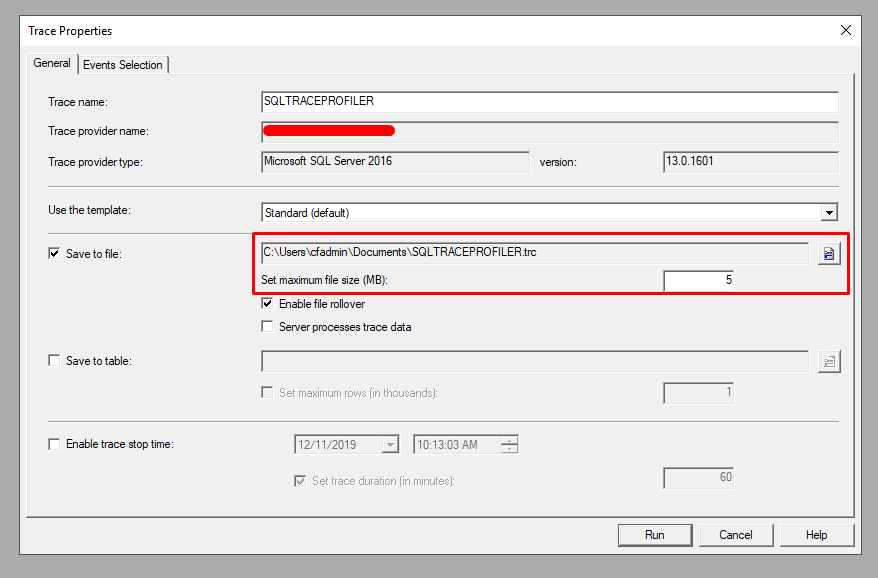 |
| Trace Properties - General |
 |
| Trace Properties - Event Selection - Showplan XML |
Check “SP:StmtCompleted” Completed under Store Procedures.
 |
| Trace Properties - Event Selection - SP:StmtCompleted |
Check all the options under “Locks”
 |
| Trace Properties - Event Selection - Locks |
3. Run the processes in NAV so the effective background SQL Query Execution can be tracked in SQL Server Profiler:
 |
| Trace SQL - SQL Profiler |
In this case, check the transaction with a maximum duration
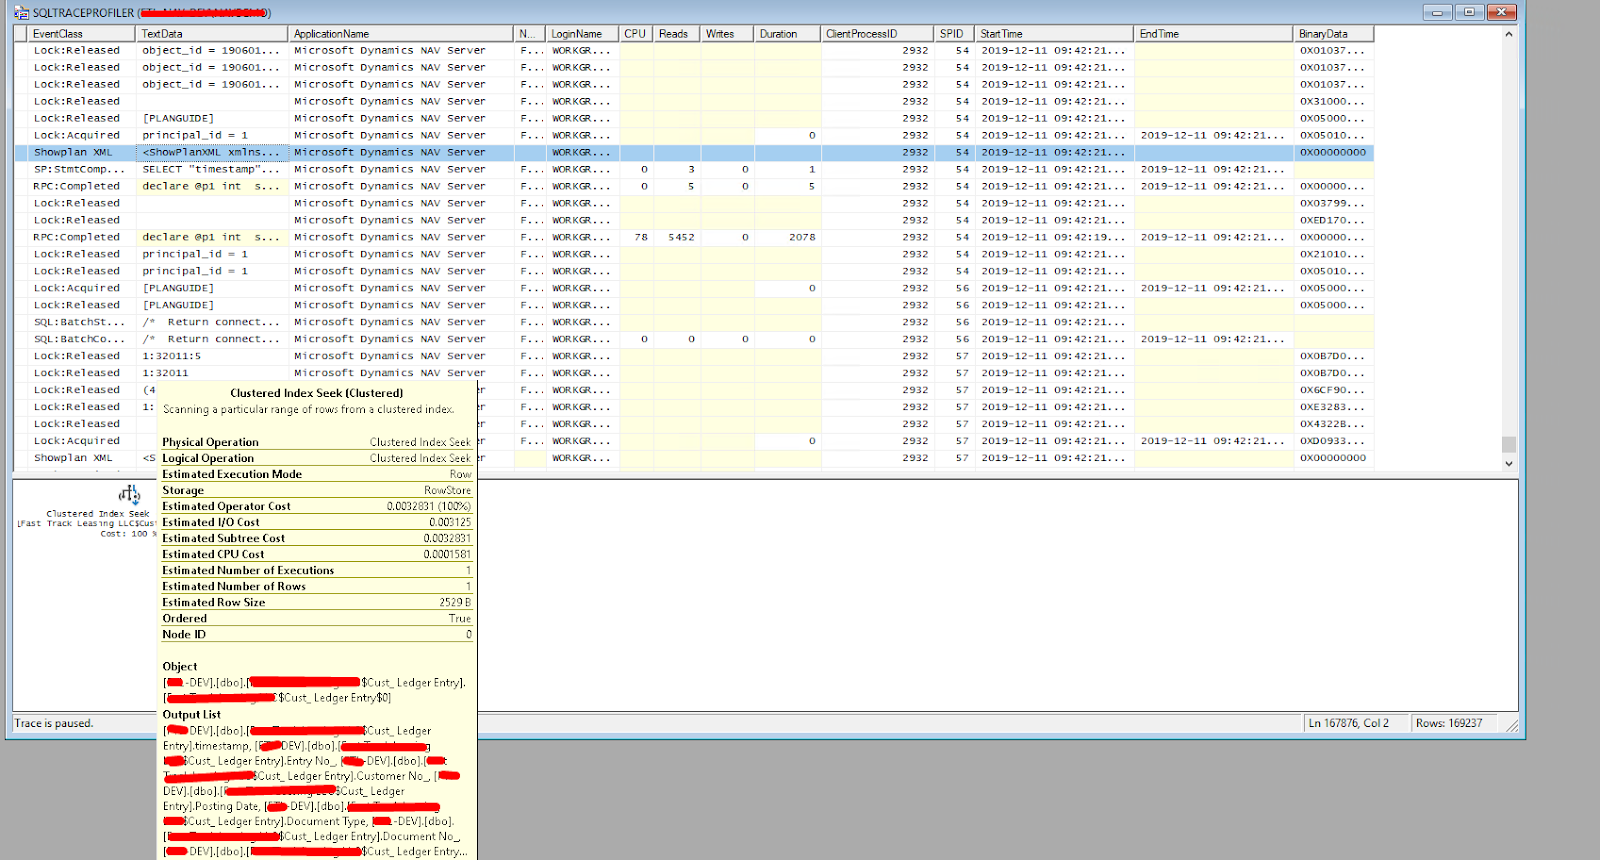 |
| Trace SQL - SQL Profiler - Showplan XML - Exec |
After finding the Query taking long time to run, you can check the corresponding CallStack in C/AL or AL.
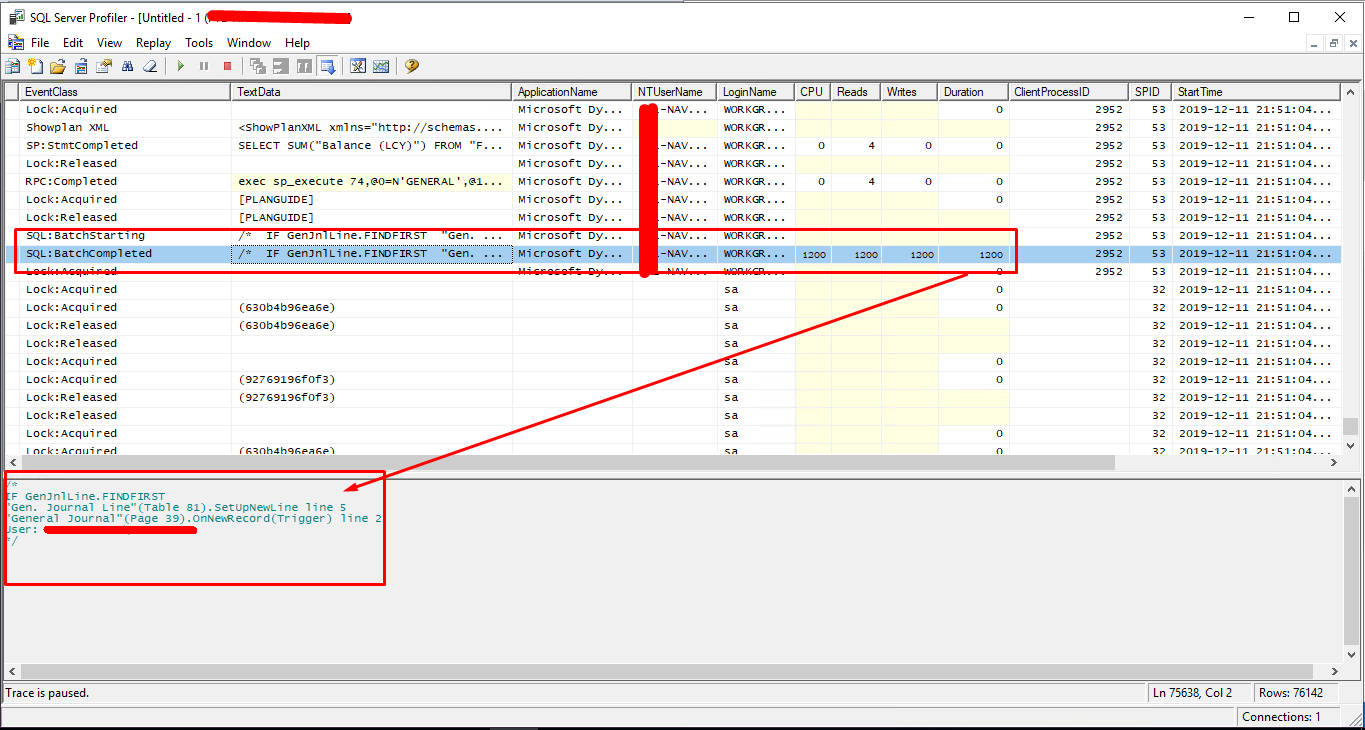 |
| Trace SQL - SQL Profiler - NAV Code - Exec |
Thus, using this method, you should be able to trace your NAV execution issues.
Conclusion:
Thus, to conclude, I had no idea about how SQL Profiler worked. With the help of a friend
from Microsoft Support (Mr. Aananth Rajadevan - https://www.linkedin.com/in/aananth-rajadevan-a342265a/). I learned what all components are present in SQL Profiler and how to monitor what is going on and find the correct C/AL Code and rectify it.
from Microsoft Support (Mr. Aananth Rajadevan - https://www.linkedin.com/in/aananth-rajadevan-a342265a/). I learned what all components are present in SQL Profiler and how to monitor what is going on and find the correct C/AL Code and rectify it.
*This post is locked for comments