


 1,856
1,856 Like
Like Share
Share
 Report
If used effectively, dashboards can be the main place for a user to hang out in CRM. Adding lists and charts is one way to engage with information, but reports can also be included in a dashboard. There are other ways out there, but this method works with Dynamics 365 CRM.
First, go to the reports section and find the report you wish to add. Click the name of the report as if you are going to run it. Then copy the URL from the top of your browser window. Paste it in to Notepad to make it easier to edit. Find the middle section where it has ‘action=filter’ and change the word filter to the word ‘run’. This will make sure the report runs automatically when you open the dashboard.

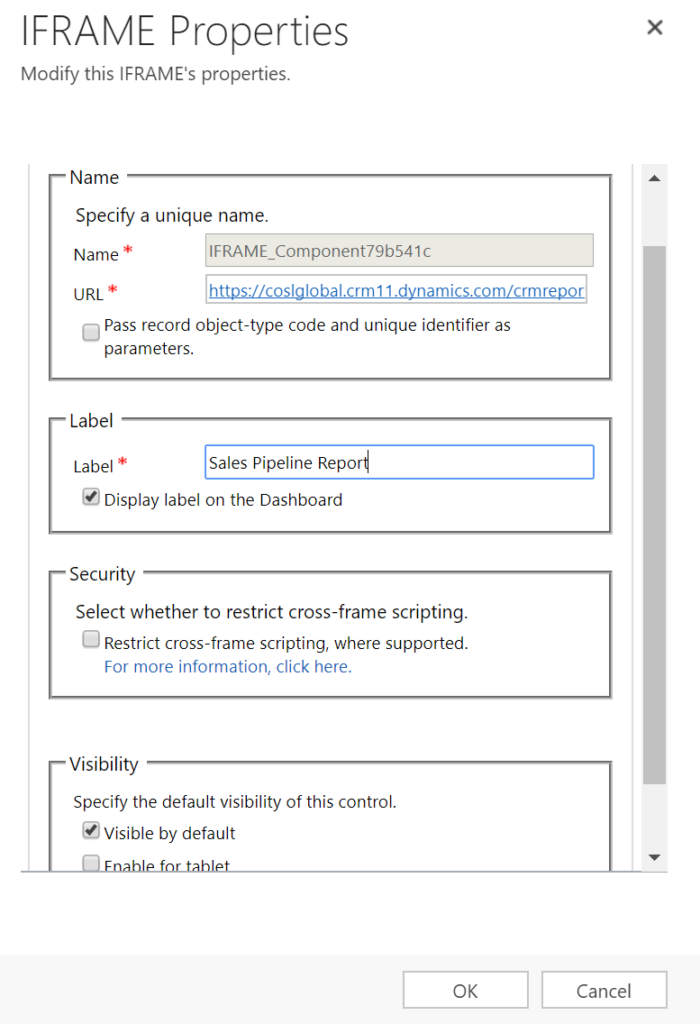
Next, create your dashboard (or edit an existing dashboard you wish to add the report to). Add a new iFrame component. Paste in the URL you just edited. Add a label if you wish. Untick the box in the security section for ‘restrict cross-frame scripting’. Then click OK to save. Save your dashboard.
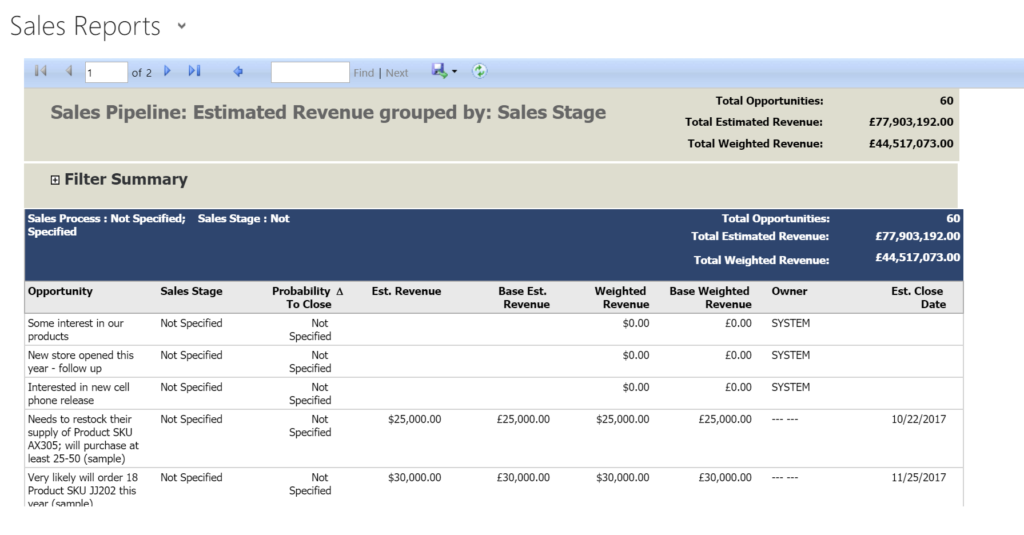
Finally, go and review your dashboard. The report will run automatically for you. You can still Edit any existing filters, and scroll through different pages as needed. You might need to expand the width and height of the component on the dashboard to fit more data as required. But that’s it! Pretty straight forward, but could also be really effective for end users that don’t have many reports to run, and spend a lot of their time in the Dashboards area.
*This post is locked for comments