


 4,009
4,009 Like
Like Share
Share
 Report
Introduction:
In this blog, I will be sharing the details of the Performance Profiler in Business Central.
Performance Profiler is a performance reporting tool that can be used to get an understanding of the performance.
Performance Profiler is a performance reporting tool that can be used to get an understanding of the performance.
Pre-requisites:
- VS Code
- Business Central Environment
Books & References:
Demonstration:
1. Start Performance Profiler:
Search for Performance Profiler in Tell me Search in Business Central.
Search for Performance Profiler in Tell me Search in Business Central.

Once the Performance Profiler page opens, you can hit the start button.

Once you hit the start button, you can now go ahead and run the process that you want to analyze for Performance. Open the process through the search directly on top of the Performance Profiler page.


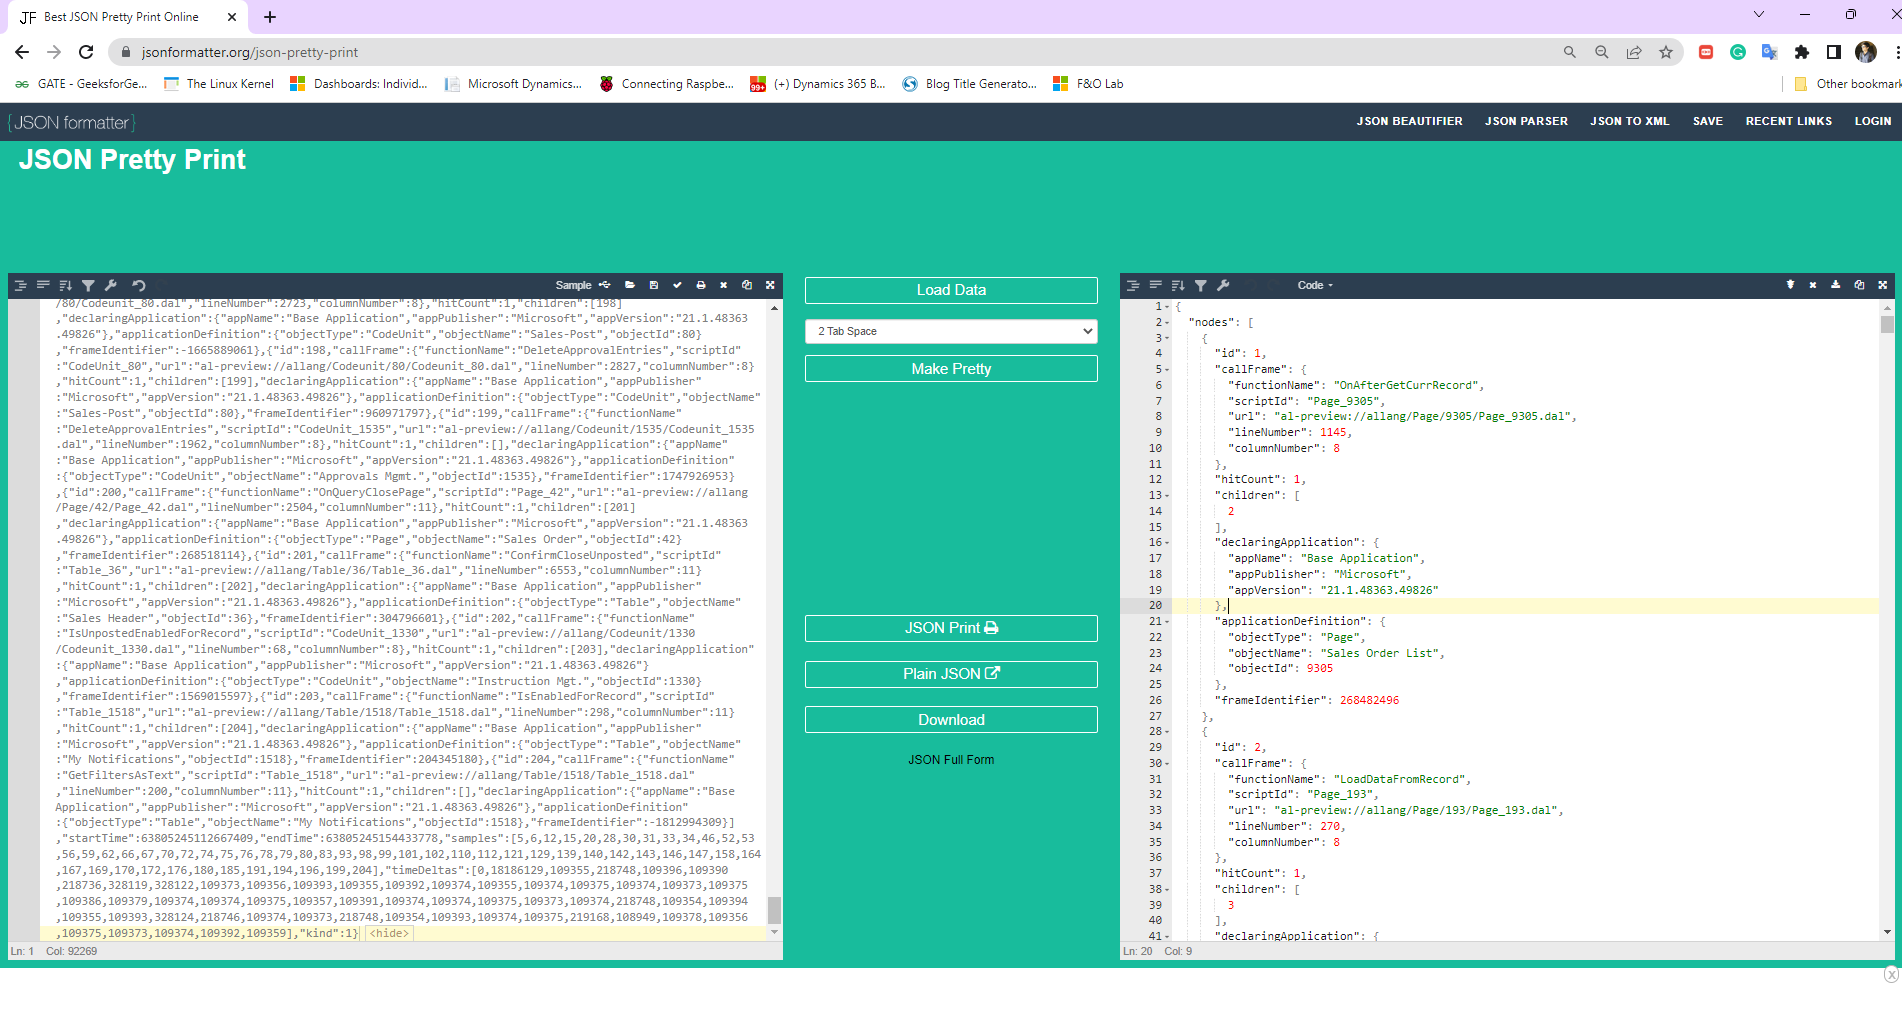
The underlying content in the Performance Profiler is JSON content. The Performance Profiler exported file when opened in VS Code.
 You can query and filter in VS Code to drill down on Performance details.


Once uploaded the result is recreated as it was run in Performance Profiler.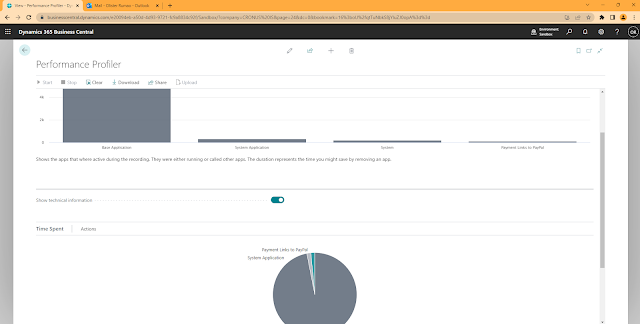
2. Stop the Performance Profiler:
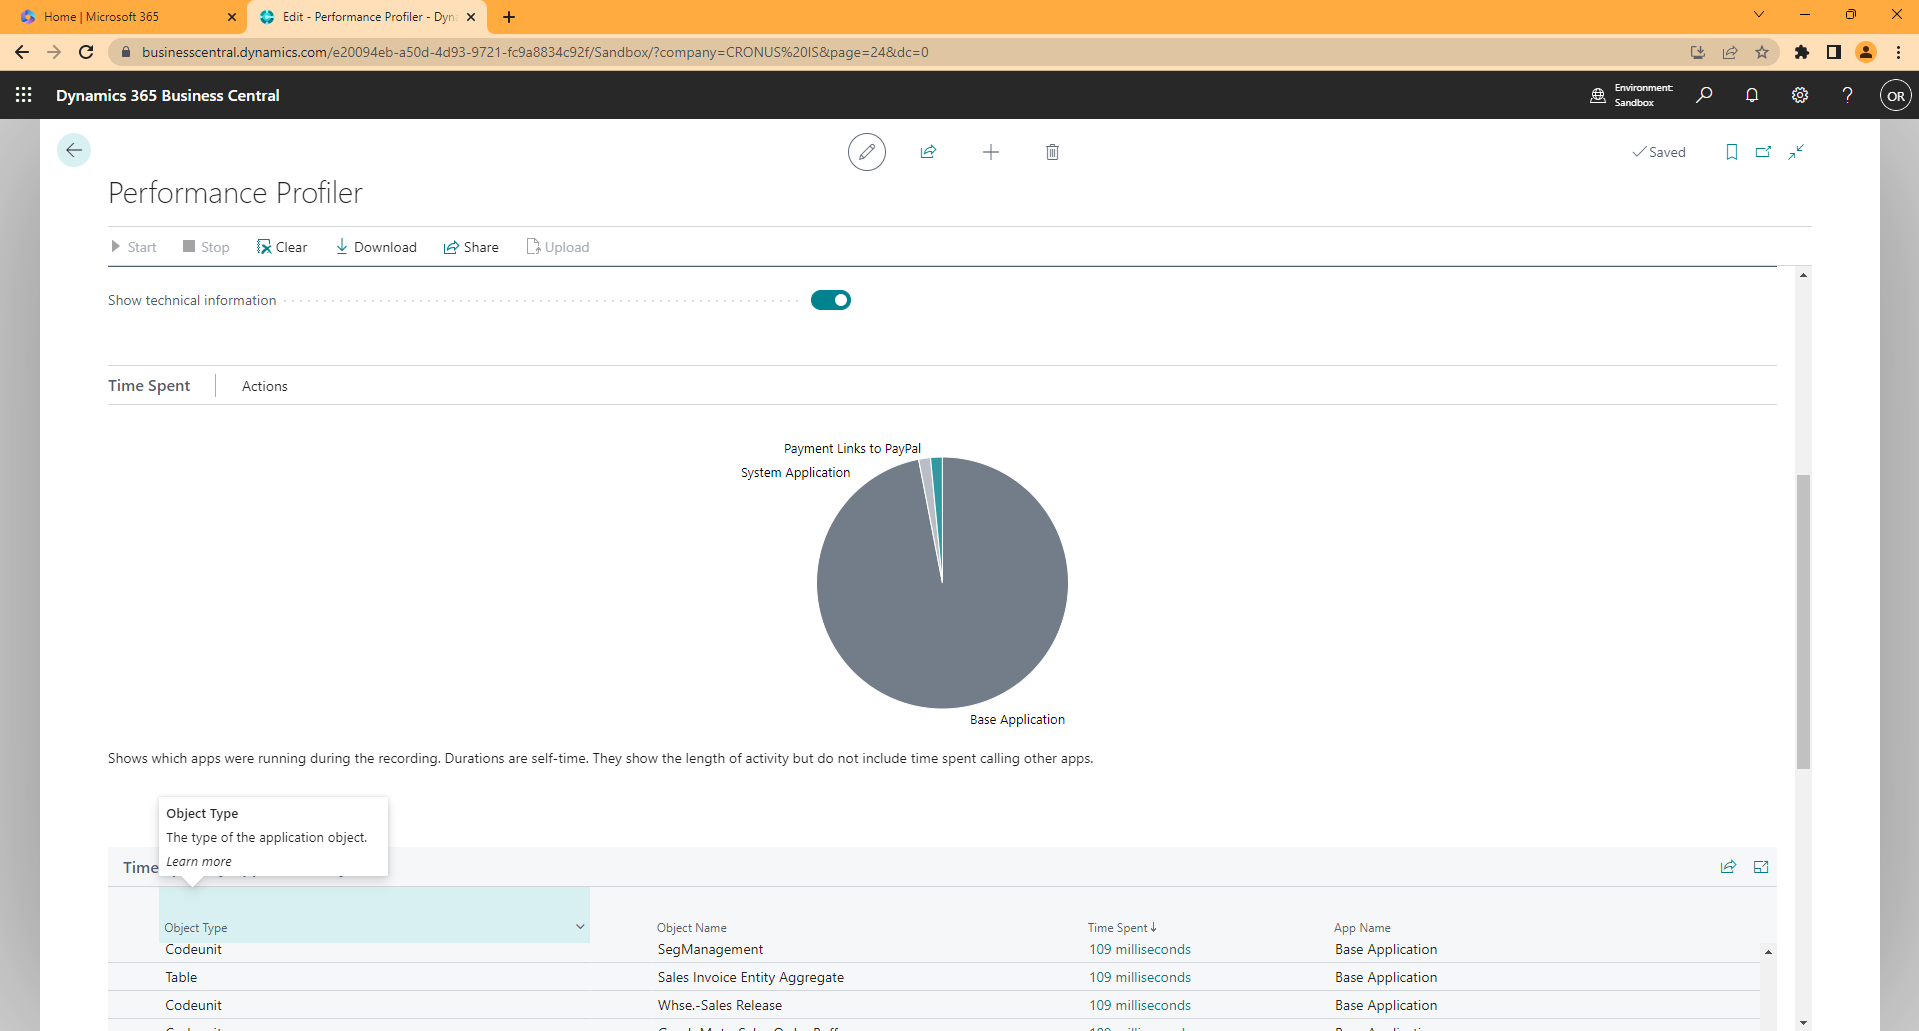
Once you have run through the process, you can just hit the Stop button and you will get the performance report dashboard.


3. Open Performance Profiler in VS Code:
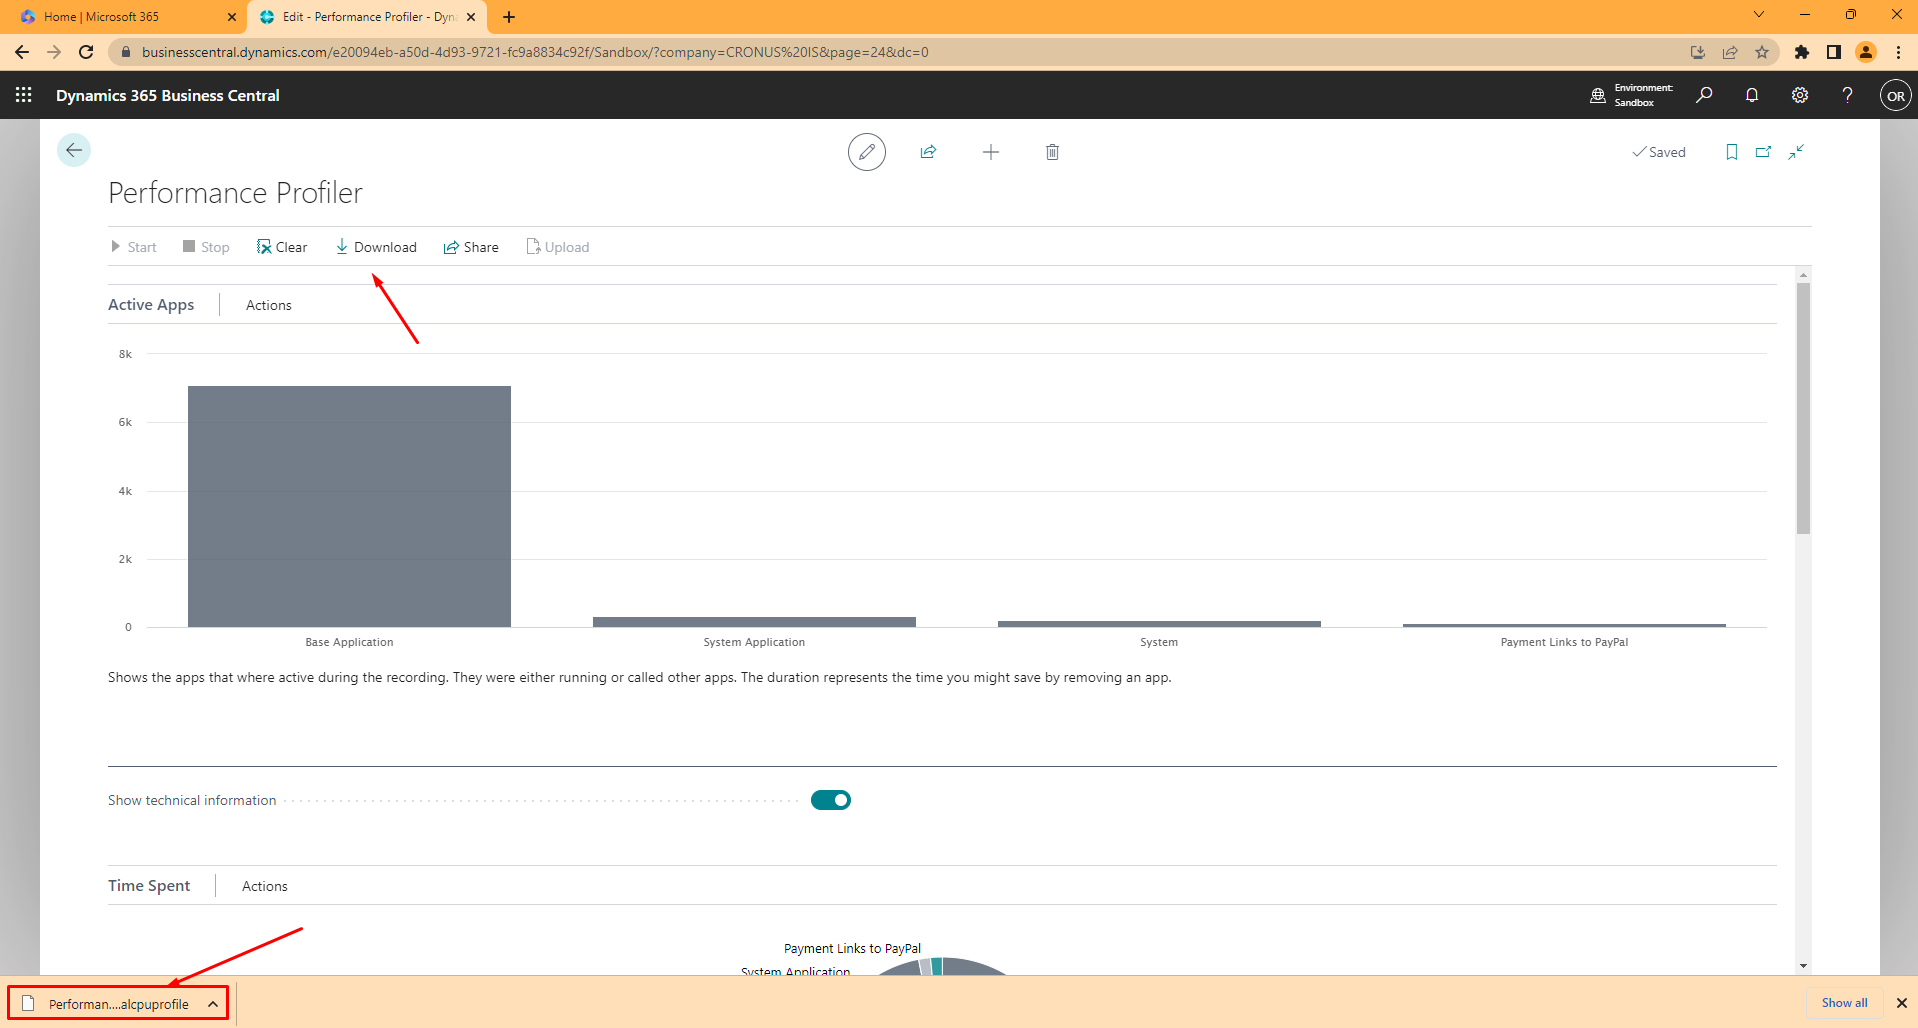
You can also download the Performance Profiler file and view it directly in VS Code.
The underlying content in the Performance Profiler is JSON content.

4. Share Performance Profiler over One Drive:
You can also share your Performance Profiler results over One Drive.


5. Upload Performance Profiler results:
You can also have the ability to upload the Performance Profiler results which were received from clients or even your own Performance Profiler.

Select the File you want to upload. The File Extension will be .alcpuprofile

Once uploaded the result is recreated as it was run in Performance Profiler.

Conclusion:
I hope this blog gave a clear understanding of Performance Profiler. In the upcoming blogs, I will share the code and logic of forming the report dashboards and UIs.
*This post is locked for comments