


 12,644
 Like
Like Share
Share
 Report
The Gantt Chart is an extremely powerfull way to present chronological data and interactions between actions. It is the go-to interface when working with tasks!
In earlier versions of AX we had a Gantt chart that looked like this:

The new Gantt chart for AX7 was designed to work with the web. Microsoft have licensed a third party HTML5 control and I really like it.
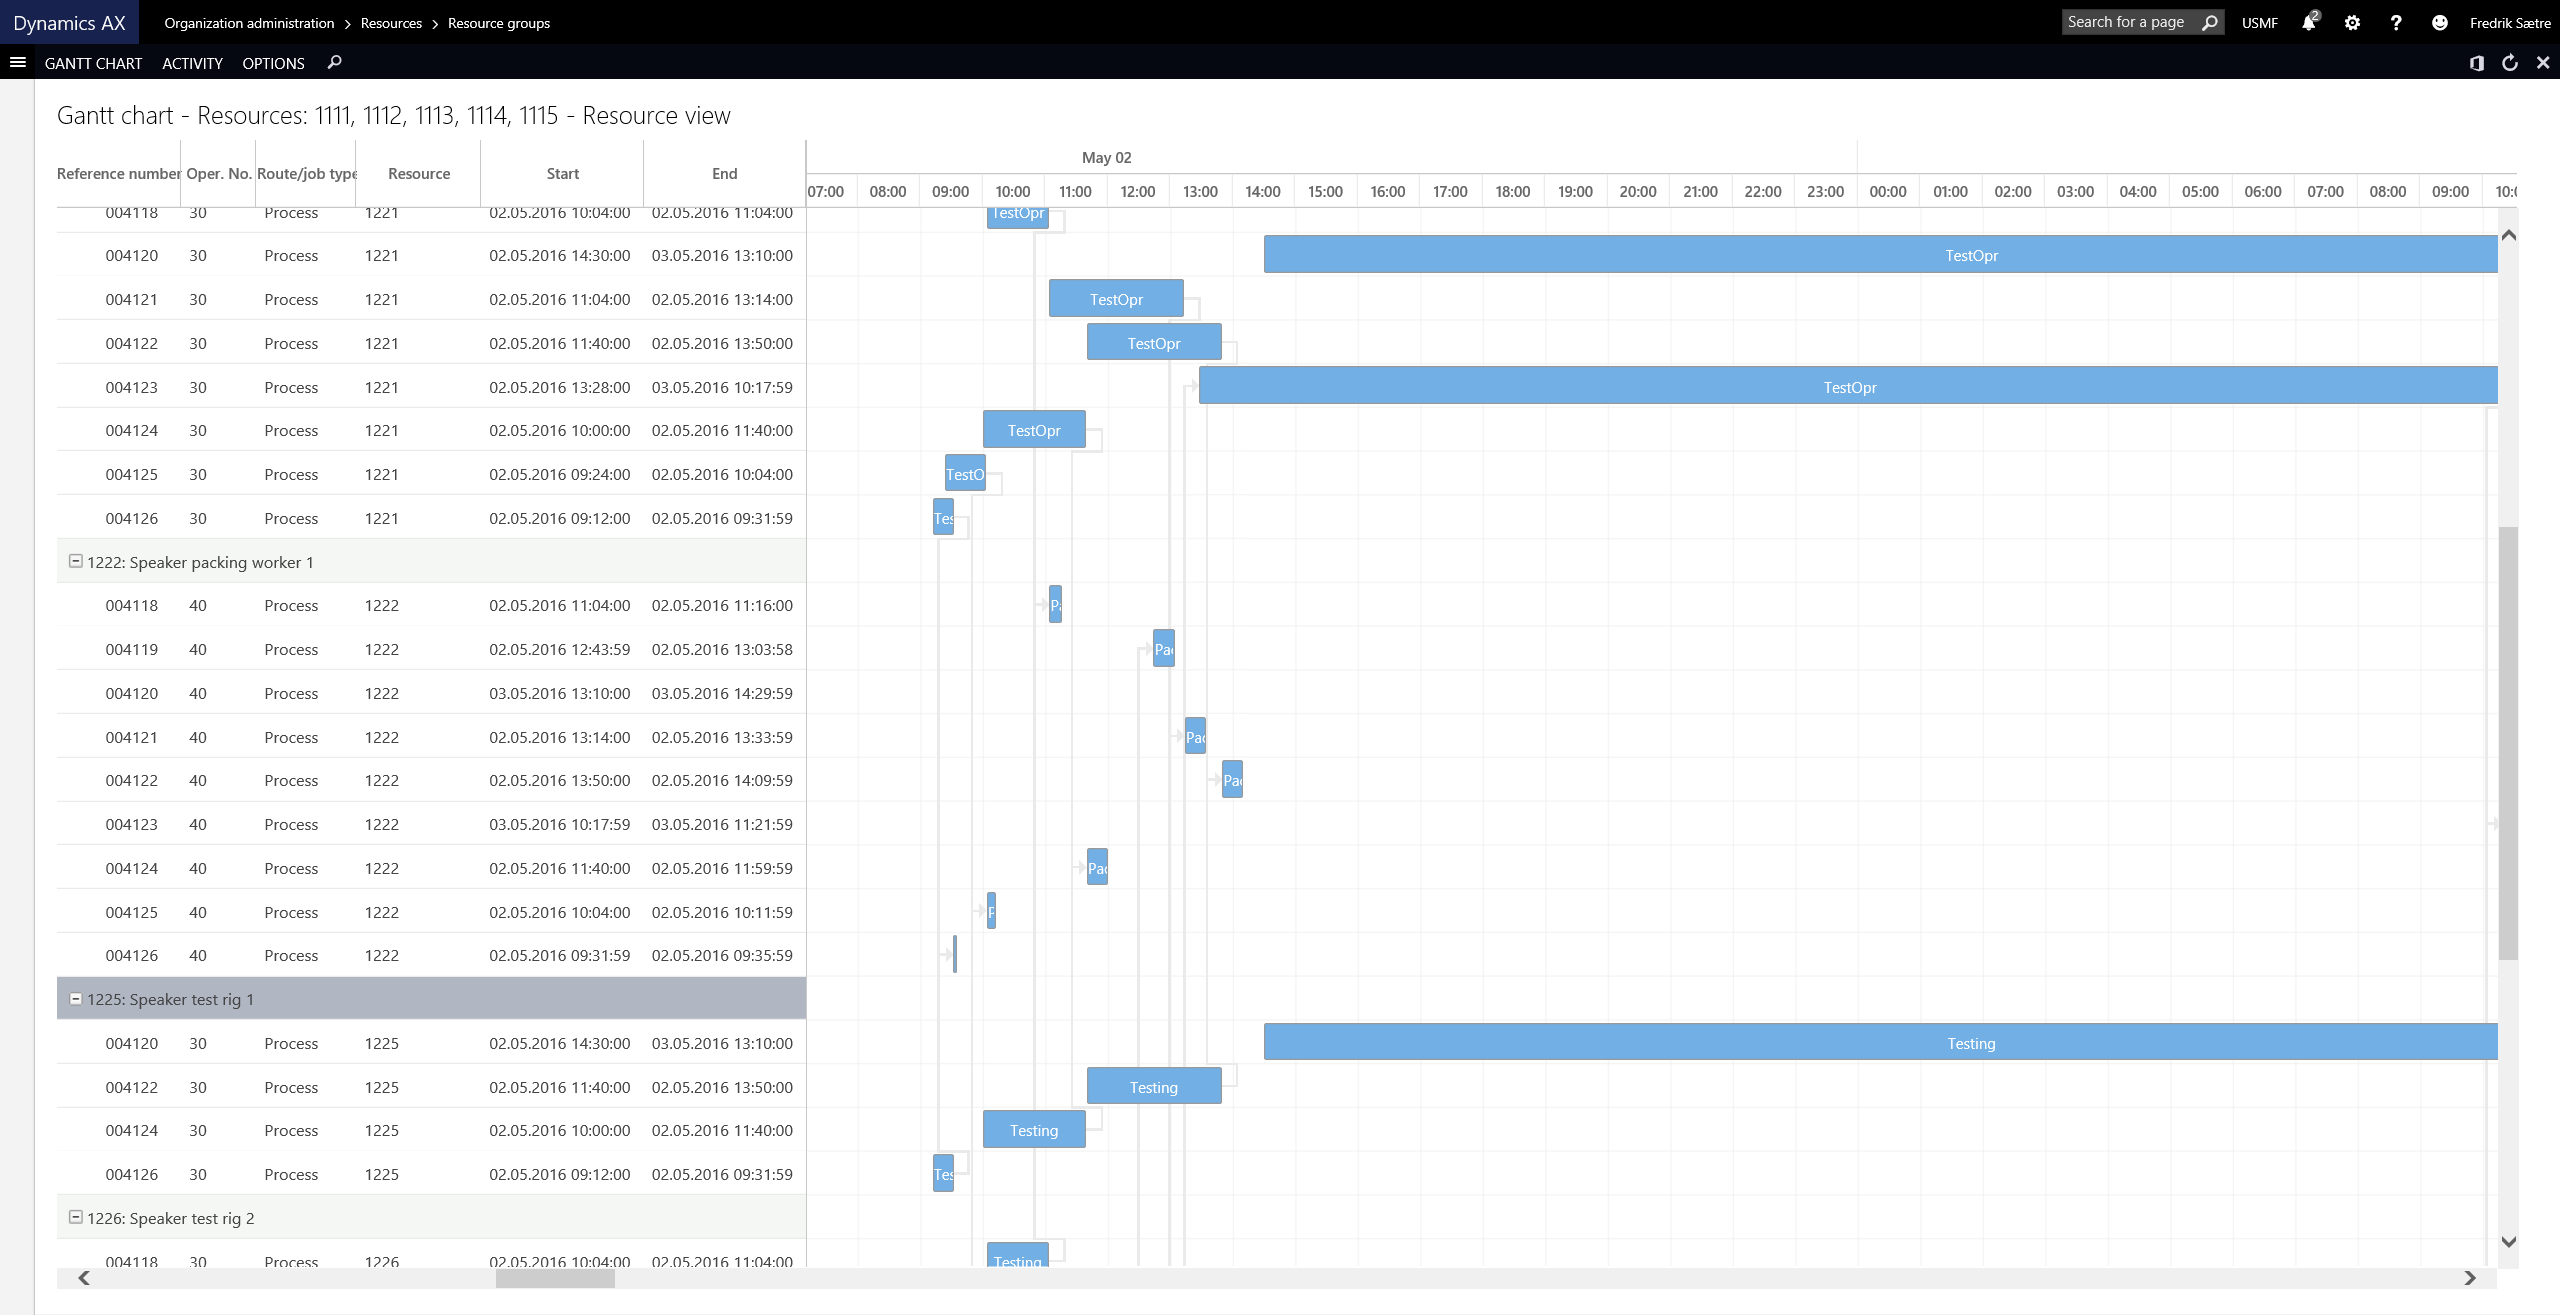
It looks very sleek and elegant and is very nice to interact with. It is touch friendly and you can customize the look to your wishes pretty easily.
Under the hood it has a wide variety of data inputs and can be configured to do many variations.

Check it out:
The standard Gantt chart is available for Project and Production resources and other places around the solution. The quickest way to get a glance at this is by job planning a production order and click the Gantt button on the Schedule tab.

There is also a form that has no menu item that you can access in your environment to play around with the tutorial that is available for you to look at:
https://[YourAXSolution].cloudax.dynamics.com/?cmp=test&f=Tutorial_Gantt

If you want to learn more about the Gantt chart, you can watch a video from October 2015 at Technical Conference where they talk about the control: https://mbspartner.microsoft.com/AX/Videos/832
Filed under: AX7

*This post is locked for comments