As part of the Success by Design framework, the FastTrack team has developed two checklists that help make the implementation of Microsoft Cloud for Sustainability as easy as possible. If you would like to view a video version of this information, see this TechTalk: Microsoft Sustainability Manager Implementation Checklist for Success | July 27-28, 2022 - Microsoft Dynamics Blog
The Prerequisite Checklist covers all the information you should know before beginning the implementation. This includes understanding what prework needs to be done, planning the implementation schedule, gathering the team, and defining responsibilities.
The Configuration Checklist describes best practices around program strategy, the data model, data ingestion, reporting, and the details around many of the sustainability-specific entities.
Prerequisite Checklist for Success
Before starting implementation, it is important to understand what is involved in the process. At a high level, setting up Microsoft Sustainability Manager involves defining your organization, importing operational data, setting up calculations, creating goals, and running reports. Depending on the size of your organization, familiarity with carbon accounting, and sustainability goals, you can expect this discovery period to take between 2 and 4 months. Many organizations leverage a cross-functional team with a range of responsibilities to support this effort. There may be multiple people within your organization who can help, including facilities managers, IT staff, department heads, and more.
The following steps were developed to ensure that you are getting the right data in the right place for the best results. We highly recommend following the order we’ve outlined below.
1. What are the overarching emission goals of the firm—carbon negative, carbon neutral, or merely reduce and report?
2. Which manufacturing plants would participate and where are they located?
3. What is the carbon intensity reporting cycle?
4. What are the key indicators to report against?
5. Who are the main stakeholders and what are their responsibilities (emissions analyst, CEO, etc.)?
6. Are there any compliance standards to follow?
7. Is a custom factor library required? The default factor library in MC4S is from the EPA.
8. Where are the key emission sources and corresponding systems?
9. What are the different formats of the emission data from these systems?
When items 1-9 are completed, you are ready for the next stage.
Configuration Checklist for Success
Once you have a better idea of your organization’s sustainability goals and requirements, it is time to begin configuring Microsoft Cloud for Sustainability to fit those needs. This second checklist will help you understand the solution scope, data model, and data flow.
It is a good idea to consider the scope of your solution before diving in. The more complex your configuration is, the more risks there are that could derail a successful implementation. Here are a few questions to ask yourself:
· Are you ingesting data from outside sources? If so, what is the frequency (one-time vs. regular cadence) and volume?
· Are you considering 3rd party tools to make the integration possible? This includes 3rd party connectors.
· Are you planning to write back from Dataverse to source systems?
· What integrations with other apps/data sources are you planning to have with cloud for sustainability?
· Have you considered the impact of daily transactions on the API entitlements, Dataverse storage, Power Automate entitlements, and Azure consumption?
Processes and Data Flow
After making these considerations, we can look at the bigger picture of how data flows throughout the system. We’ll start with Master Data.
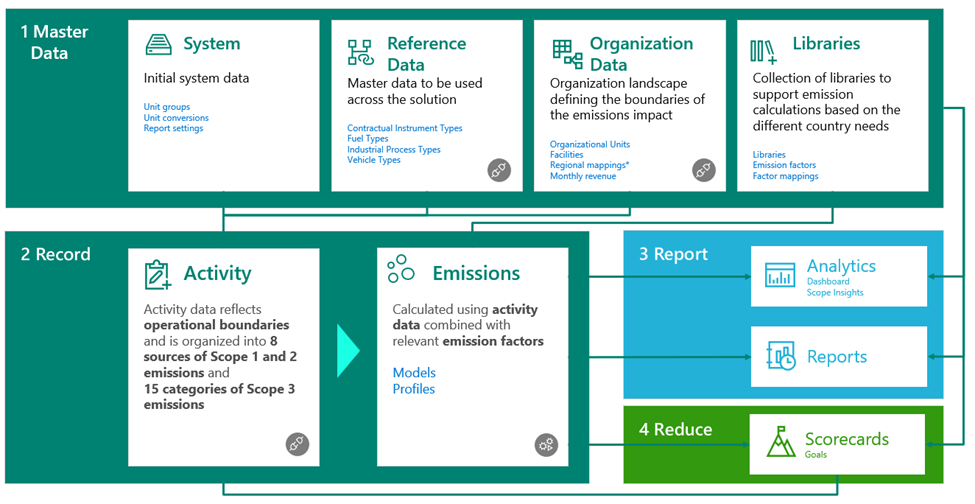
In the System Data, we preload unit groups and unit conversions, using the most common forms of carbon accounting. But this isn’t necessarily complete, especially if you need to do any special conversions. Reference Data includes data types such as contractual instrument types, fuel types, or industrial process types. For example, if we want to calculate mobile combustion emissions, we need to know fuel types and vehicle types.
We have included some standard definitions in the solution based on the Greenhouse Gas Protocol, but customers might have different ones. The same is true for Organization Data. You can define the company information and facilities here, but also the mappings and the revenue to calculate the concept we call carbon intensity, based on revenue units. Connectors are available for Reference and Organizational Data. The Libraries contain emission factors and factor mappings. The factor mappings are unique to this Microsoft solution.
Record data contains Activity Data, which tracks everything that is in scope related to contributions, and Emissions, which are calculated from activity data inputs. Activity Data represents operational boundaries and will look different for every organization, but all will have three scopes. Emissions are calculated using activity data combined with relevant emission factors, profiles, and models. The emissions calculations are dependent on all the pieces of the supporting data and activities.
Once you’ve calculated emissions, the results and insights are generated through Analytics and out-of-the-box Reports. Scorecards are subsequently populated from these results and are used to track your reduction progress. You don’t need to refresh or push data to Analytics as it automatically updates.
Best practices
There are multiple things to keep in mind for setting up supporting data:
· Regulatory requirements in different countries will dictate your needs, determining things like emission factors.
· Keep units and conversions in mind because the wrong units or conversions can cause calculation failures. We do have a method to easily convert units of measurement. If you have conversions set up in the application, your calculations will work.
· Consider the level of granularity you’ll need for reporting purposes. For example, if you need to track a specific line of business, you’ll want to set up “Facility + Line of business” in the name, as in: “Contoso Pod facility – Organic beans.”
Also, as with all data ingestion, it is important to plan your approach based on organization landscape, technical capabilities, and source data format. You should be partnering with IT to manage the ingestion and define roles for data management and security. If you are new to data ingestion with the Power Platform, we suggest starting simple with manual or file-based data ingestion methods.
Data model
Now, let’s look at the data model, focusing on the sustainability-specific entities that need to be configured.
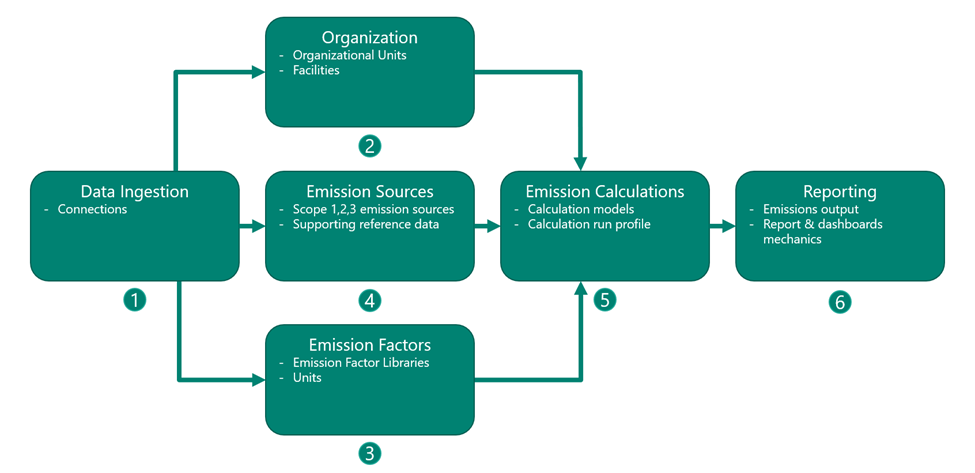
Having a clear understanding of the Organization will drive a successful platform enablement that will fulfill the right level of recording, reporting, and plans for reduction. Defining the attributes of the organization correctly is important so that formulas can be calculated correctly later. For example, some countries use the metric system while others use imperial units. These different systems affect calculations. Other organization data includes facilities, regional mappings, and the carbon intensity reporting cycle.
Emission Factors are required to calculate emissions. There are emission factors for every emission source or category that is applied to the activity data, and they are used to calculate the emission values for corresponding gases. Factor libraries are where emission factors are stored, and they consist of groups of related emission factors that often have the same source. It is important to describe your requirements for what needs to be monitored and measured for all emissions for your company.
After defining emission factors, start to think about where your organization interacts with these resources and list all these interactions. These Emission Sources can be broken down into three scopes: Scope 1, 2, and 3 emissions:
1. Direct - Scope 1 emissions include Carbon Dioxide (CO2), methane (CH4), and nitrous oxide (N2O) that are emitted from stationary and mobile combustion, and from inadvertent fugitive emissions. Fugitive emissions can also include hydrofluorocarbons (HFCs), per-fluorinated compounds (PFCs), sulfur hexafluoride (SF6), and nitrogen trifluoride (NF3).
2. Indirect - Scope 2 emissions are indirect emissions from the generation of energy that is purchased from a utility provider. In other words, they are all greenhouse gas emissions that are released into the atmosphere from the consumption of purchased electricity, steam, heat, and cooling.
3. Indirect – Scope 3 includes all indirect emissions (not included in scope 2) linked to the company’s operations. There are 15 categories of scope 3 emissions, which are notably the hardest to track.
In addition to categorizing your emission sources, it is encouraged to define your emission reference data, consider the formatting (and how it will be exported), and identify the location of this data. Then, we can start to perform relevant calculations on these sources.
Calculation Models help to bring activity data and emission factors together, so you can calculate the amount of greenhouse gas emissions that are associated with various activities. There are several default models that are included in Microsoft Sustainability Manager for each of the three scopes. It is important to review these existing models before adding new ones of your own. Along with these models we recommend defining how you will measure against these calculations, asking what good and bad values are when monitoring emissions. Calculation profiles then can be used to configure the calculation models to run against the data set. They can be mapped by activity connection or any entity (reference data, emission source, etc.).
Finally, after all these other data model components are in place, we can Report on these emissions data. There are several out-of-the-box dashboards present in Microsoft Sustainability Manager, including the Sustainability Dashboard, Emissions Overview Dashboard, Renewable Energy Dashboard, and all three scope emissions dashboards. It is important to define the Carbon Intensity Reporting cycle and annual period reporting cycle in MSM for these reports to work properly.
Going Forward
These checklists represent the beginning of your journey with Microsoft Cloud for Sustainability. Setting the groundwork for this project and making sure your organization has a good understanding of its own sustainability goals as well as how you can best use this product will give you the best chance for success. This will be challenging work, and you should be prepared to dedicate sufficient time, effort, and resources to make this project successful. And don’t forget, Microsoft has many different resources to help you along the way. We wish you the best of luck on your sustainability journey!


