Currently in Dynamics 365 CE, you are able to turn a subgrid on a form into a chart using the classic interface.
We are building out a client portal so that clients can also see these same charts when viewing the records. Unfortunately, the current version of displaying charts from CE on the portal require you to pass in the Chart ID as well as the System View ID. The problem is that the view is not filtered based on the context of the record.
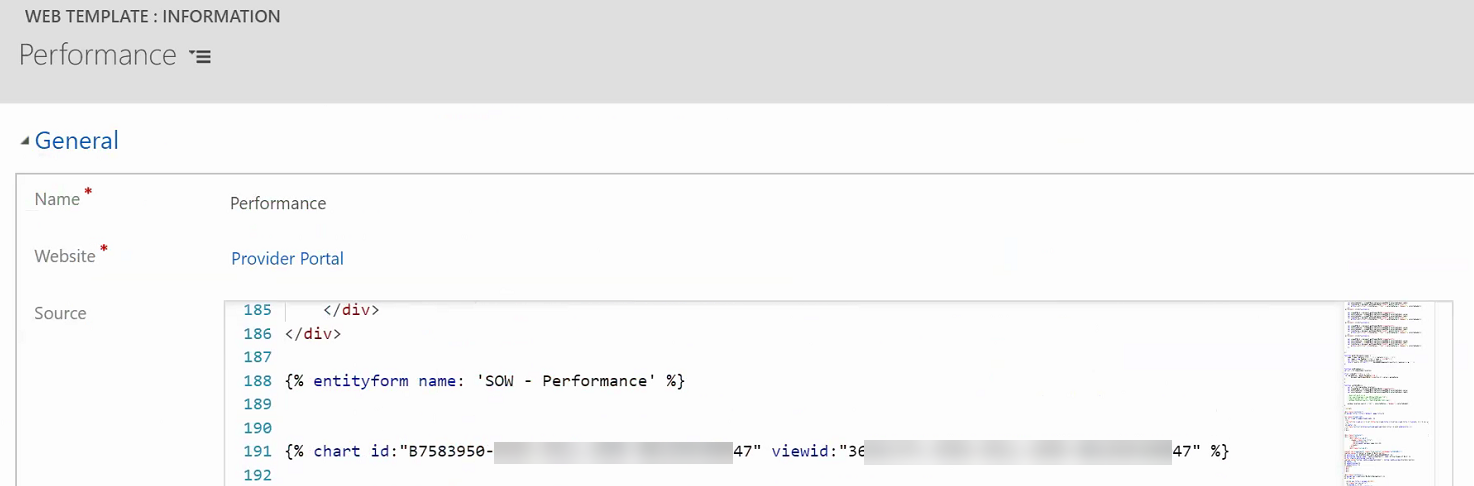
The work around that we are considering right now is to use Liquid to pass in the ID from the URL to do a query and then display the results in a HTML chart. This gets away from the ability of the user internal and external seeing the information the same way.


