web
You’re offline. This is a read only version of the page.
close
Skip to main content

Notifications

Announcements

No record found.

Community site session details

Community site session details

Session Id :
Microsoft Dynamics CRM (Archived)

Sorting by Percentage: Why does 100% show up below everything else?

(0) ShareShare
ReportReport
Posted on by

Been trying to google my way through this and I'm not really sure why this is occurring.

Screenshot-2016_2D00_10_2D00_09-09.27.57.png

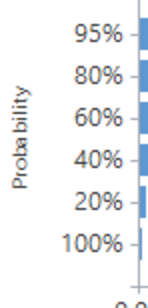
When I export data from opportunities and load it into excel, it also sorts incorrectly. However, if I were to manually create 95%/80%/100%, it sorts fine. My guess is that somehow it's not treating it as a percentage properly, but I haven't been able to find out where to set this!

*This post is locked for comments

I have the same question (0)
  • Suggested answer
    Community Member Profile Picture
    on at

    Hi,

    I suspect that because your percentages are labels and Excel is treating them as text, sorted in descending alphabetical order. Therefore 100% appears under 20% because it begins with '1', which is alphabetically lower than '2'.

    Is it possible to export the labels as decimals (or floats, etc), then format the axis labels within Excel instead? Have a look at the format of your export and the data type of each column. I believe you will find your answer there.

    Below is an example of what I mean. My source data is a decimal. I have formatted the decimal as a percentage in Excel. It therefore sorts automatically as a number in the correct order.

    04316.untitled.png

    Good luck.

    Please remember to mark as verified if a member of the community helps you.

  • Community Member Profile Picture
    on at

    Seems like this is the exact same problem: https://community.dynamics.com/crm/f/117/t/161307

    No good resolution there. 

  • Suggested answer
    Wouter Madou Profile Picture
    3,392 on at

    Can you correctly sort your view on the probability field?

    If yes => that should automatically translate to your chart.

    If no, I would create a new field probability_decimal and auto-fill it with the value of the probability.

    Export the chart, set the format of the legend to Format="0'%'" (show % without decimal values) and the series as well (LabelFormat for the series). Also, set a order on the attribute of the new field.

    Import the chart, publish.

    That should be it I guess.

Under review

Thank you for your reply! To ensure a great experience for everyone, your content is awaiting approval by our Community Managers. Please check back later.

Helpful resources

Quick Links

Responsible AI policies

As AI tools become more common, we’re introducing a Responsible AI Use…

Neeraj Kumar – Community Spotlight

We are honored to recognize Neeraj Kumar as our Community Spotlight honoree for…

Leaderboard > 🔒一 Microsoft Dynamics CRM (Archived)

#1
SA-08121319-0 Profile Picture

SA-08121319-0 4

#1
Calum MacFarlane Profile Picture

Calum MacFarlane 4

#3
Alex Fun Wei Jie Profile Picture

Alex Fun Wei Jie 2

Last 30 days Overall leaderboard

Featured topics

Product updates

Dynamics 365 release plans