web
You’re offline. This is a read only version of the page.
close
Skip to main content
Community site session details

Community site session details

Session Id :
Microsoft Dynamics CRM (Archived)

Showing wrong values on Y axis in Chart

(1) ShareShare
ReportReport
Posted on by

 Hi all, i am getting wrong values in the chart. As shown in the image (Red high lightened)  

graph1.jpg

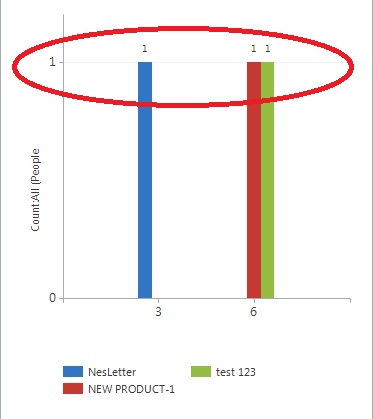
As its showing 1 in Y-axis (People), but in real 1 for Nesletter, 2 for test 123 and 3 for NEW PRODUCT-1. I have also associate the chart with the view. In that specific View - columns are showing correctly but in the chart, it shows 1 for all. I don't know why..

Can anyone help me out of this?

Thanks

*This post is locked for comments

I have the same question (0)
  • Suggested answer
    Alagunellaikumar Profile Picture
    6,212 on at
    RE: Showing wrong values on Y axis in Chart

    Hi

    Did you mention count aggregate in the chart?

  • Verified answer
    Abdul Wahab Profile Picture
    12,119 Moderator on at
    RE: Showing wrong values on Y axis in Chart

    Hi Tim Joe

    I think you are not using number field. Please used number instead of text field.

    Thank You

Under review

Thank you for your reply! To ensure a great experience for everyone, your content is awaiting approval by our Community Managers. Please check back later.

Helpful resources

Quick Links

Responsible AI policies

As AI tools become more common, we’re introducing a Responsible AI Use…

Abhilash Warrier – Community Spotlight

We are honored to recognize Abhilash Warrier as our Community Spotlight honoree for…

Leaderboard > 🔒一 Microsoft Dynamics CRM (Archived)

#1
Aric Levin - MVP Profile Picture

Aric Levin - MVP 2 Moderator

#1
HR-09070029-0 Profile Picture

HR-09070029-0 2

#3
MA-04060624-0 Profile Picture

MA-04060624-0 1

Last 30 days Overall leaderboard

Featured topics

Product updates

Dynamics 365 release plans