Hi,
I was wondering if there is a way to create a chart using OTB tools to create a chart that would have multiple categories, in this case by year. The only way I can think of accomplishing that if there were varying fields being drawn from i.e. one year with a one set of data and another year with another set. Other wise it's charted as a single line on the chart.
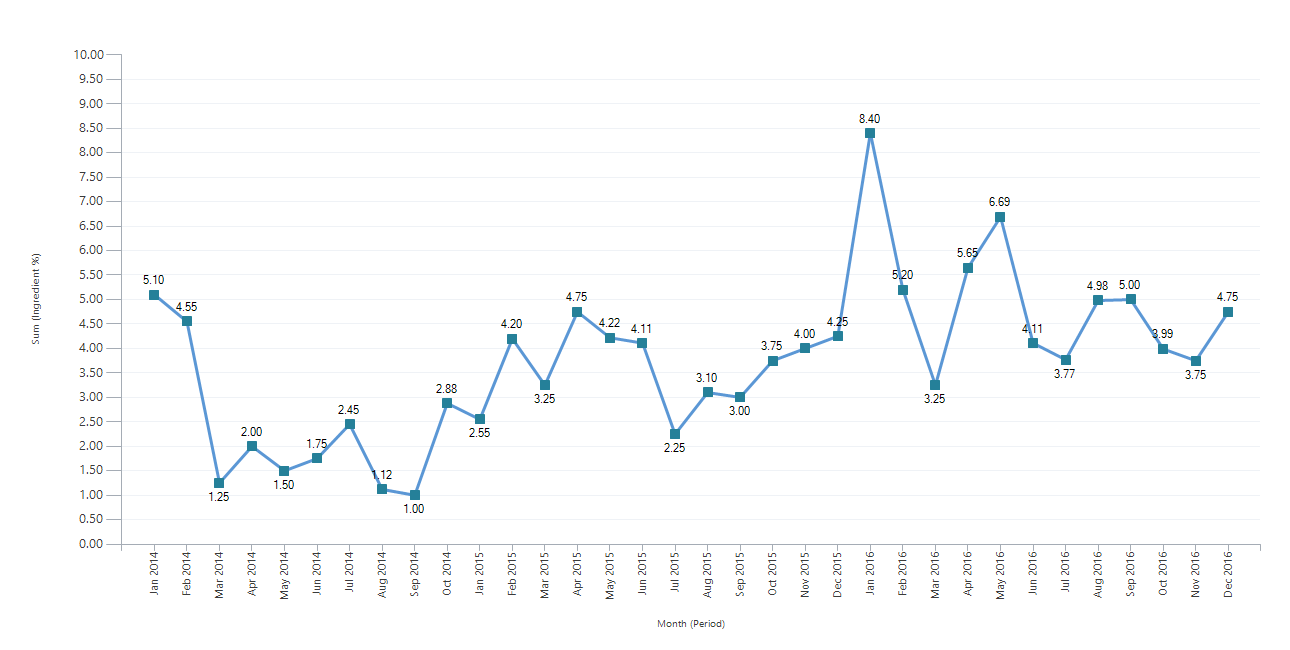
Something like this but would have different trend lines for each year. If not, is it achievable via fetch xml manipulation. Any hints or direction would be appreciated
*This post is locked for comments
I have the same question (0)


