Dear All
I am new to CRM and report builder (or any SQL related tools) and I am still learning to do a many things.
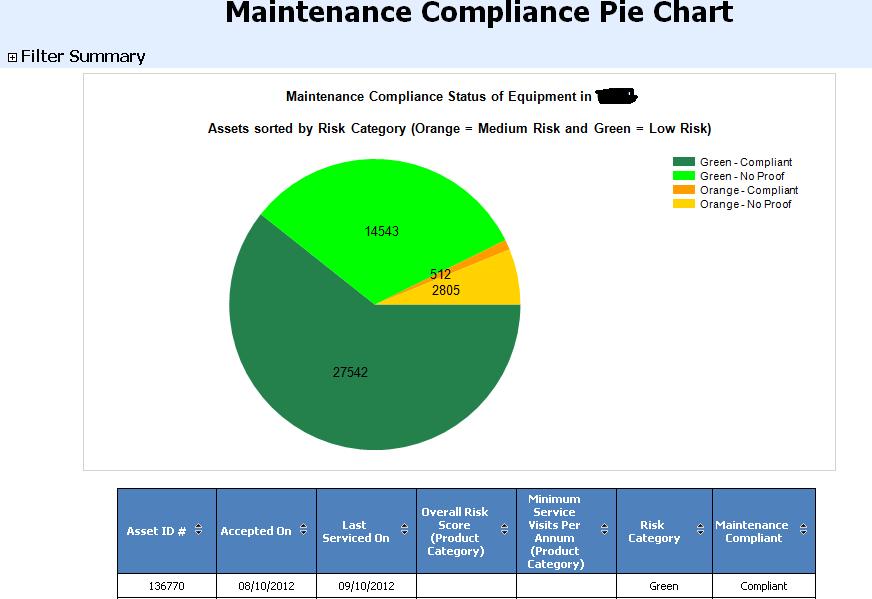
I have managed to design a pie-chart report that shows Number of Assets, and when they were maintained. The fields I have for the table seven columns.
| Asset ID # |
 |
|
| Accepted On |
|
|
| Last Serviced On |
|
|
| Overall Risk Score (Product Category) |
|
|
| Minimum Service Visits Per Annum (Product Category) |
|
|
| Risk Category |
|
|
| Maintenance Compliant |
|
|
This report was designed using SQL Report Builder 2008 R2 (.rdl file)., which was eventually uploaded into our CRM 2011 database to run a scehduled report every hour. Now my problem is I would like to make this a drill through report such that whenever I click on each slice it should give me the results and table for that specific slice.
I believe I need to create seperate reports for each slice and try and link it as a url Action. So, I tried to design another report with only the Slice results and added the url link to my original .rdl file. The steps I took were as follows
1. Create a secondary report i.e secondary .rdl files, for each slice and upload it to the CRM server
2. Run the secondary report and hit F11 and copy the url for the secondary report
3. I then open my original .rdl file. and select one of the data label on the Pi-Chart .... right click it and select Series label properties.
4. Under properties I click on Action and under Change Action Options select 'Go to url' and paste the link for one slice. Save it
5. Unfortunately, when I select one Data label on the pie-chart, it highlights or select all data labels. So when I right and go to properties to add Actions, it will apply the same action for all the other data labels.
I am not sure how can I give, seperate action for each Data label. Meaning for each Legend 'Orange-Compliant', 'Orange-No Proof', 'Green-Compliant', 'Green- No Proof', there would be four seperate url links respectively.
Not sure if I have made myself clear enough for this


