


 487
487 Like
Like Share
Share
 Report
So, let's begin with it. I will be adding two charts one for showing showing cost of resource allocation per department and another for showing projects count per department.
- Sign in PowerApps.
- Open your model driven app and click on Edit.
Steps required for creating bar chart. In this we will showing cost of resource allocation per department.
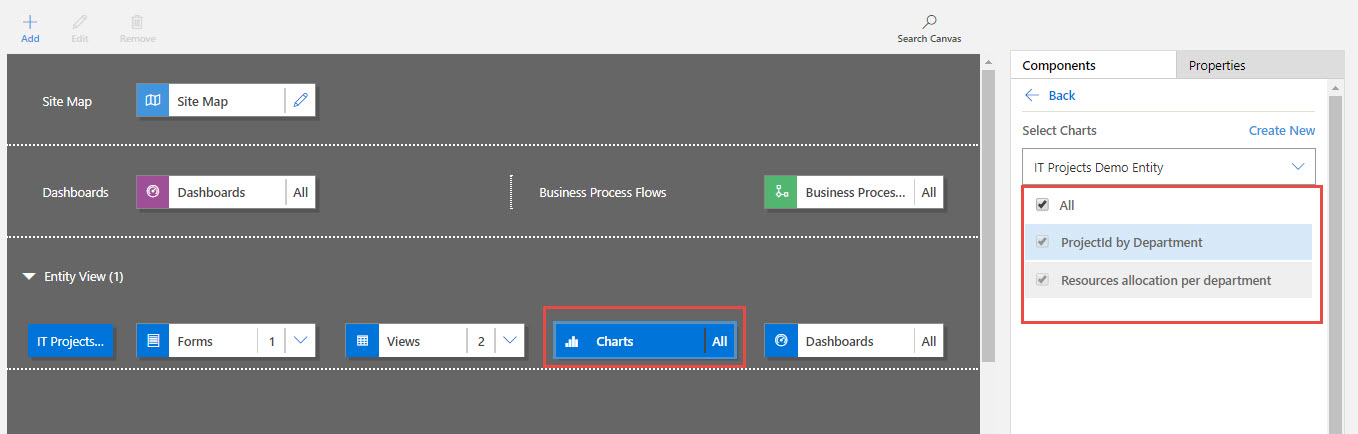
Step 1) Click on charts and it will show you its components. Then click on Create new button to create new chart. It will open new window.

Step 2) Click on charts then bar chart.

Step 3) Enter the name for chart and select series and category columns.
In my case I have selected Series to resource allocation cost and category to department.
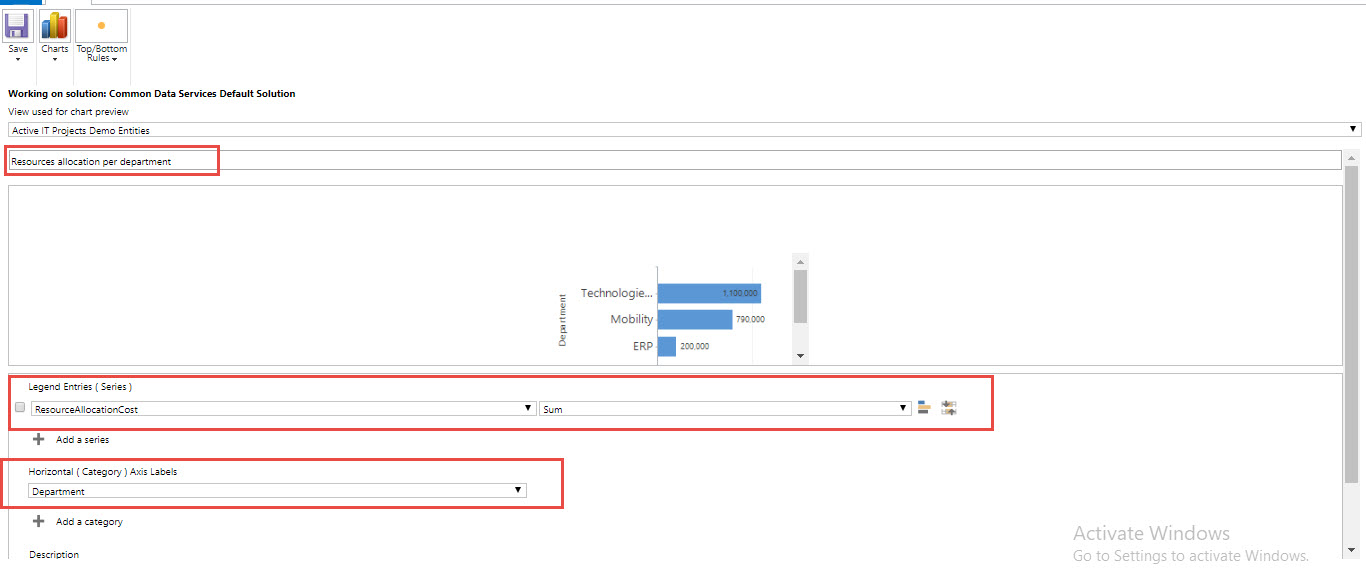
Step 4) Select Save and close button.
Steps required for creating pie chart. In this we will showing project count per department.
Step 1) Click on charts and it will show you its components. Then click on Create new button to create new chart. It will open new window.
Step 2) Click on charts then pie chart.
Step 3)Step 3) Enter the name for chart and select series and category columns.
In my case I have selected Series to project Id and category to department.

Step 4) Select Save and close button.
Finally go back to Site map designer and select your newly created charts.
In next part we will learn how to create dashboards.
*This post is locked for comments