Power BI is an analytical tool to design interactive Reports, and dashboards using Visuals, which allows information to be collected from different types of Sources such as Dataverse, SQL, Excel Workbooks, OData Feed, etc.
There are various visuals available to design our Power BI report, such as Card, Slicer, and Matrix in Power BI. Microsoft has announced a new feature in Power BI, namely “Slicer (new)” and it is an advanced version of the existing “Slicer” Visual.
In this blog, we will go through the process of designing a Power BI report to implement the use of this Slicer (new) Visual. Let us consider a business scenario where a Salesperson wants to filter out the list of the Customers of the organization. This implies that the report will exclusively showcase Customers owned by the Salesperson we have selected.
In the preceding blog post, we accomplished this using the “Slicer” and now, in the current post, we will delve into the upgraded iteration of the established “Slicer (new)“.
Let us have a look at the steps to accomplish this requirement using Power BI:
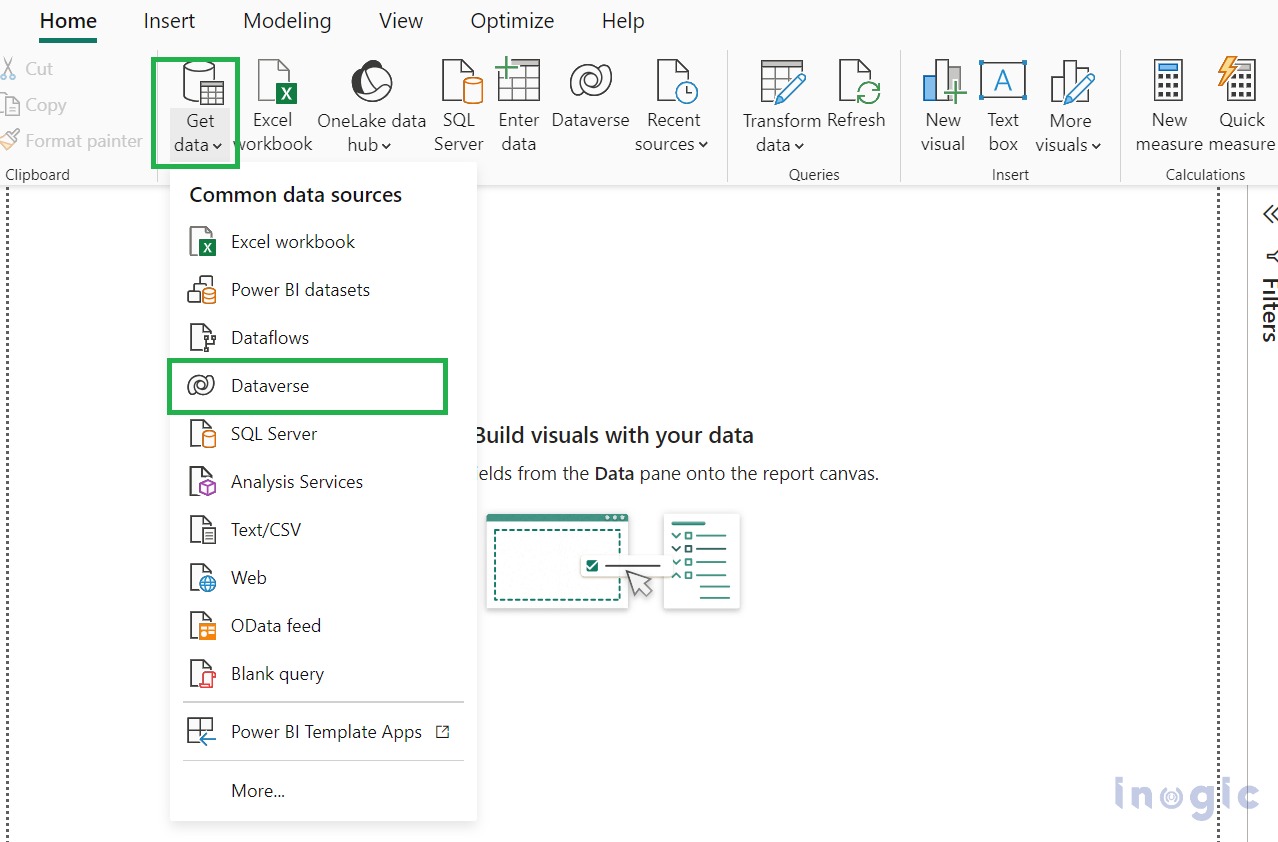
Step 1: Navigate to Power BI Desktop to Microsoft Dataverse. Look for the ‘Get Data’ option. Click and Expand ‘Get Data’ and select ‘Dataverse’.
Please refer to the screenshot given below:

You shall be prompted to log in with the user credentials to establish the connection to Dataverse.
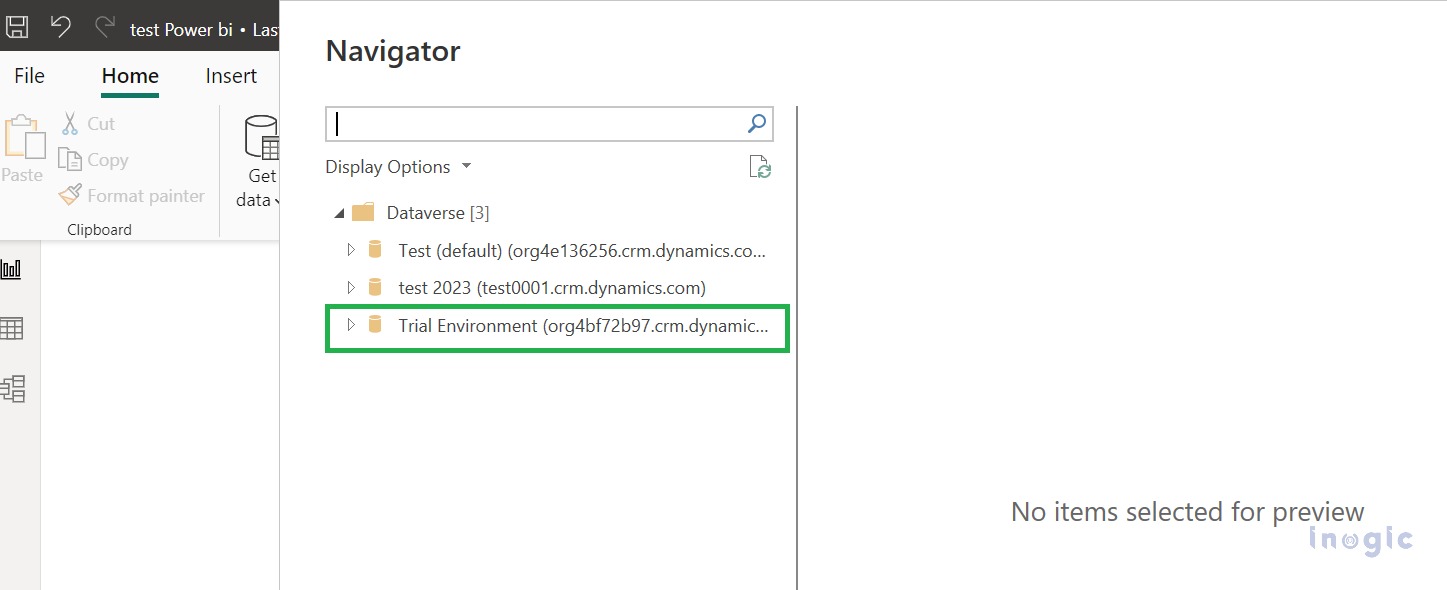
Step 2: After establishing the connection, select the necessary data from Dataverse. When you click the ‘Dataverse’, an environment selector window pops up. Select an environment from the options offered.
Please refer to the screenshot given below:

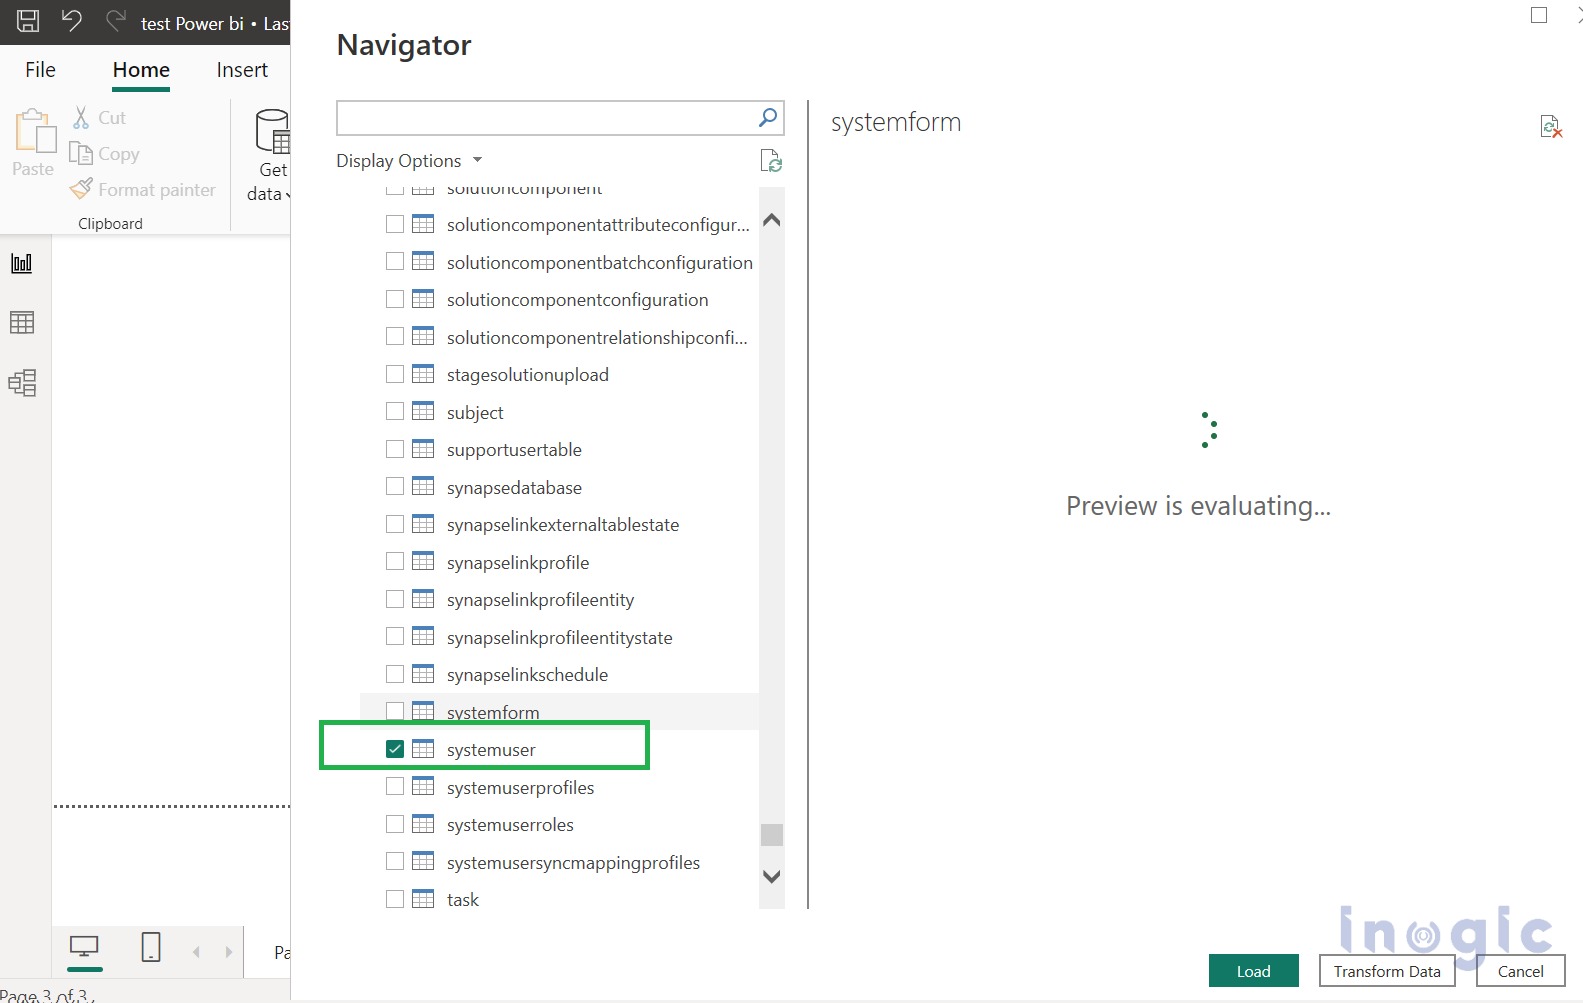
Step 3: Now, select the tables as indicated in the screenshot (You can select any table as per your requirements).

On selecting the tables from the appropriate environment, data can directly be loaded or transformed.
All the Table columns are visible in the sitemap. Select Slicer (New) from Visualization, and then select the columns Full Name from the System users table.… Read More »


 Like
Like Report
*This post is locked for comments