Introduction:
In today’s competitive world, customer satisfaction is very important. Providing appropriate and timely service lets you earn your customer’s trust for life. Also, knowing your customer enables you to provide better service and optimize your agent’s productivity.
‘Customer Service Insights’ is now embedded in Dynamics 365 customer service with the inbuilt AI capabilities. The AI-driven technology lets customer service agents decide on how to improve resolution rates, reduce wait times, and decrease customer service costs by looking at the overall case resolution insights, backlog trends, and historical comparisons. It helps to evaluate performance, business impact and also to identify inefficiencies in the system.
This experience allows you to view the historical analytics directly within Customer Service. Several AI-driven reports and dashboards are available which can be reviewed by service agents and managers. In Dynamics 365 2021 release wave2, you will observe there is out-of-the-box report available named “Customer Service Historical Analytics”.
To view the report, open “Customer Service hub”–>under the “Service” area–> navigate to “Insights”–>open the “Customer Service Historical Analytics”.
When you try for the first time to view the report, you might get the below warning “Your reports are being provisioned. Please allow up to 24 hours for the process to complete”
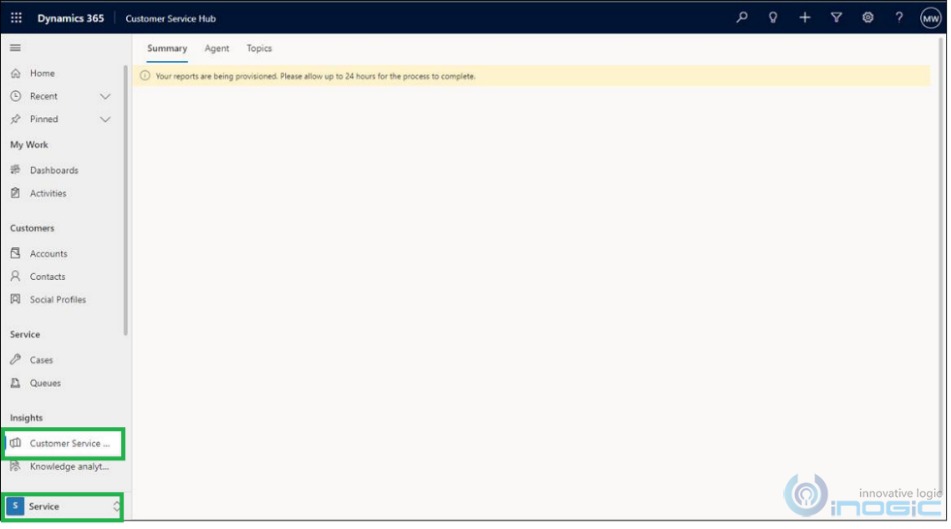
NOTE: While I was exploring, it took hardly 1-2 hours for completing the provisioning. Remember that provisioning time may vary for you.
Navigate to the “Service Management” area–>under Insights–>Settings, the “Customer Service historical analytics” setting is available.
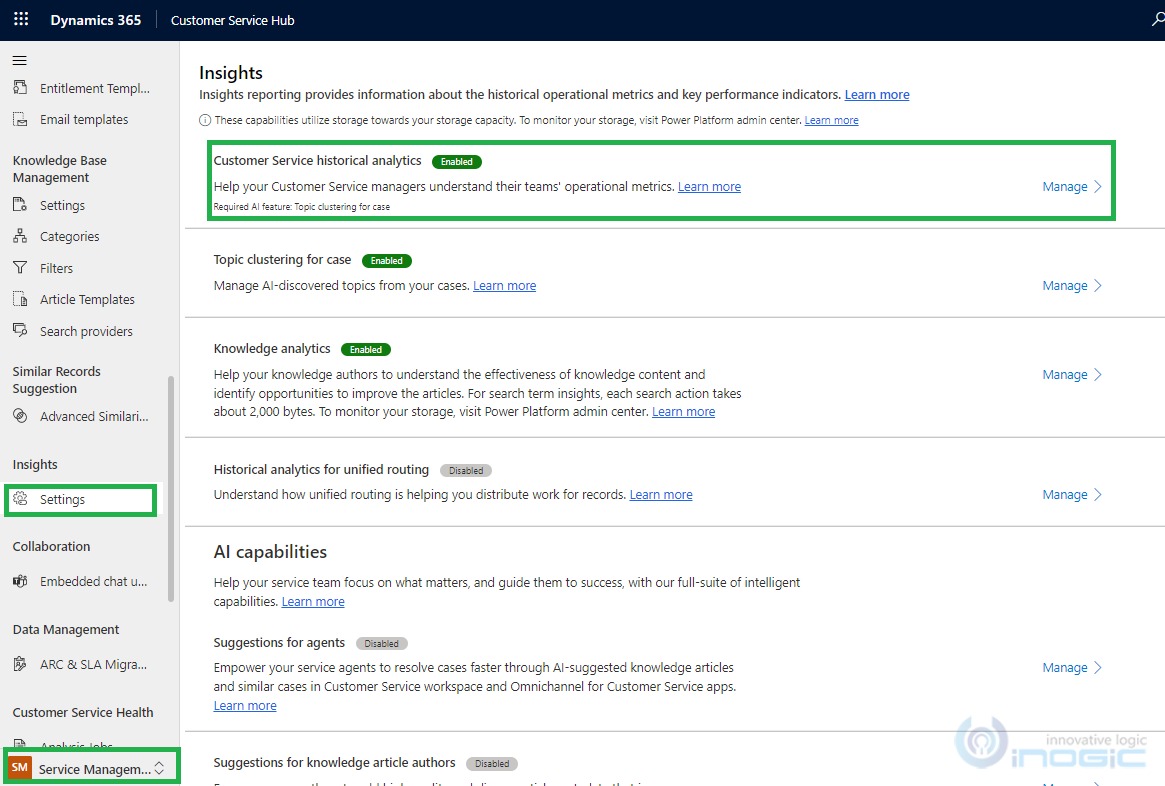
If you click on manage, you will observe that this feature is enabled by default.
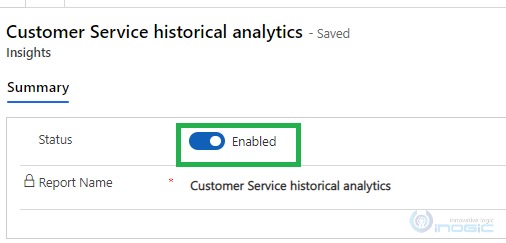
NOTE: If you disable this feature then this report will no longer be visible on the sitemap under “Insights”.
Once provisioning is completed, the report can be seen in 3 dashboard formats “Summary”, “Agent” and “Topics”.
The following dashboard reports are available for “Customer Service historical analytics” reporting:
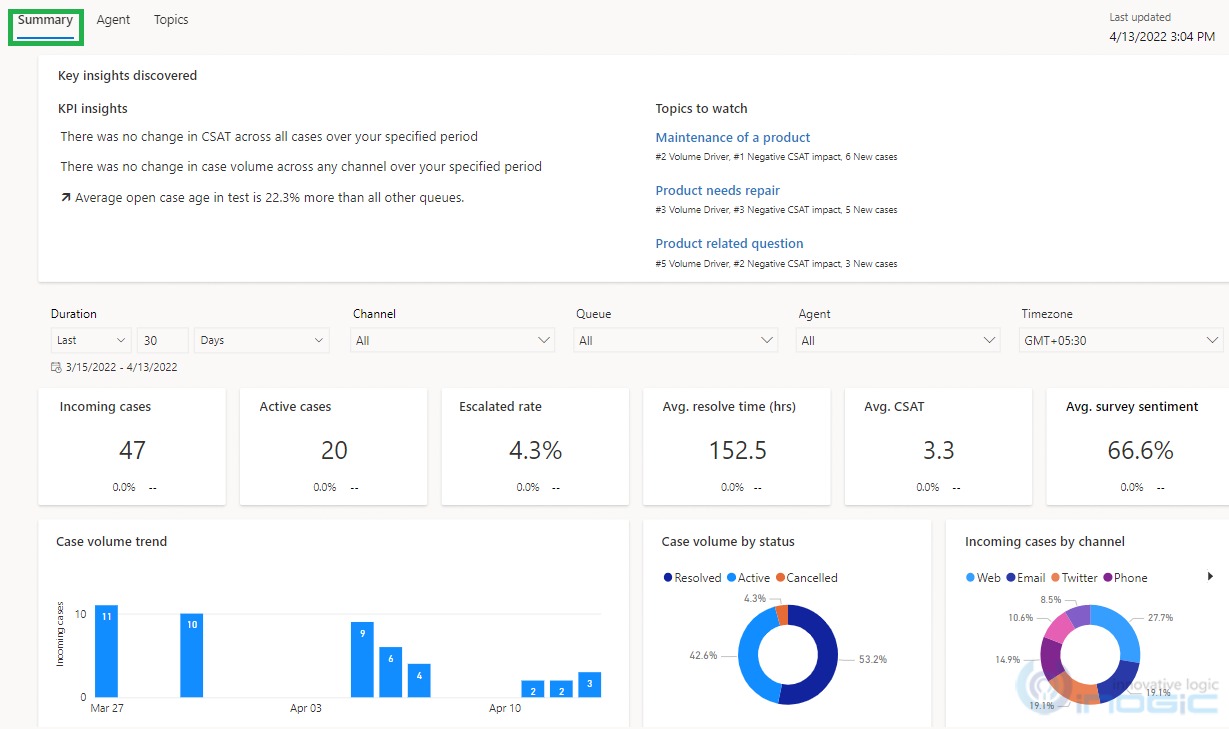
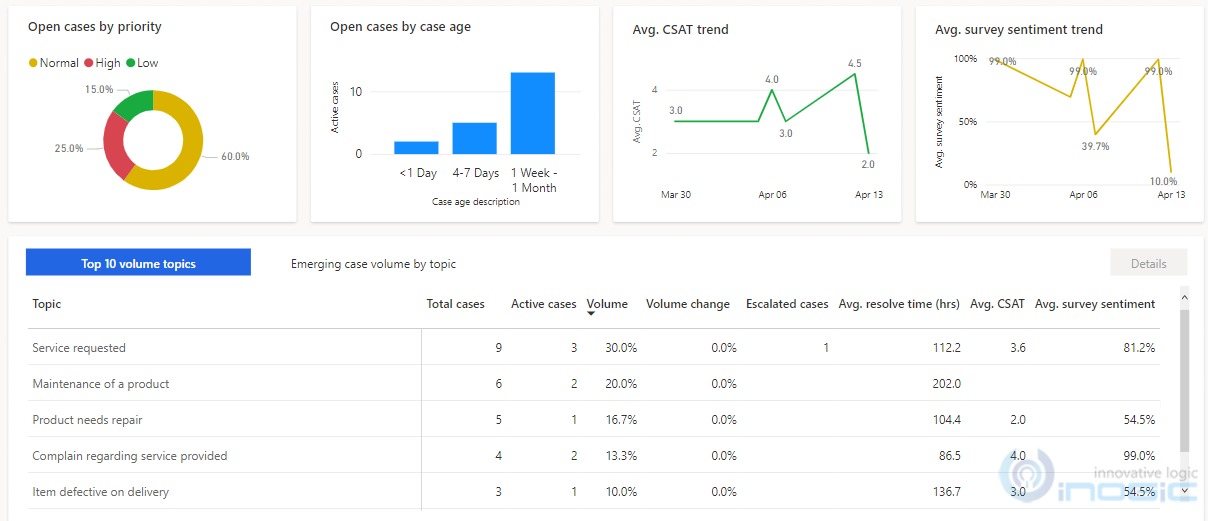
1. Summary Dashboard – By default, the user will see the “Summary” dashboard. The Summary dashboard provides the overall summary and displays case topics or the emerging case topics generating a high volume. For more details, refer to this doc.
Topics to watch– At the rightmost corner of the above “Summary” dashboard, you will find the “Topics to watch” area where there is flexibility available by which customer service managers can quickly have a look at top issues.
Need- New cases that match the topic will be automatically added to the topic group. This can help customer service managers to identify areas for improvement that can have the greatest impact on system performance.

Topic clustering is enabled by default when you enable historical analytics. You can refer to this doc for more details. To enable it, you have to navigate to the “Service Management”–> Insights–> Settings, where the “Topic clustering for case” setting is available.
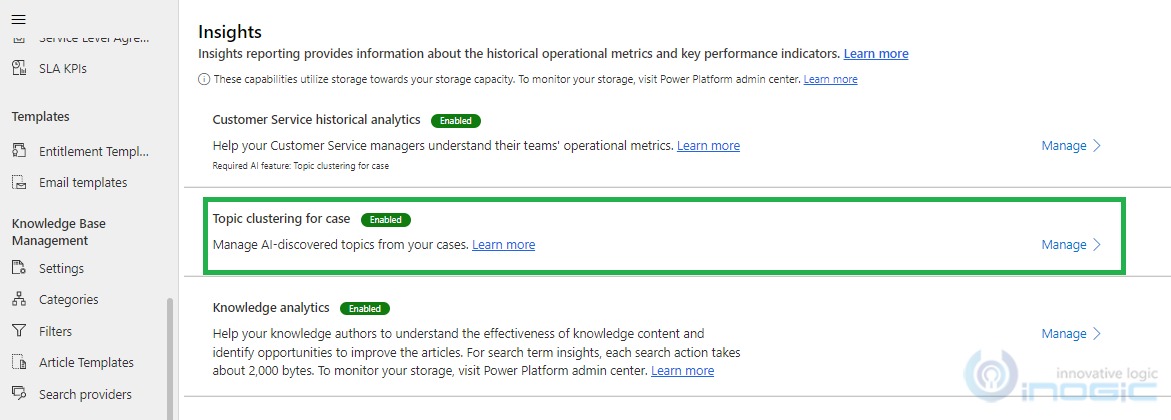
You can click on Manage and can configure as per your need. You can also change the attribute from your case entity where your organization provides the best description of the customer’s issue.
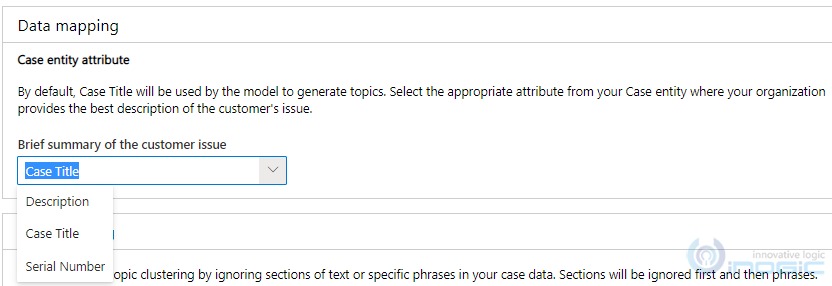
NOTE: By default, “Case Title” will be used by the AI model to generate topics.
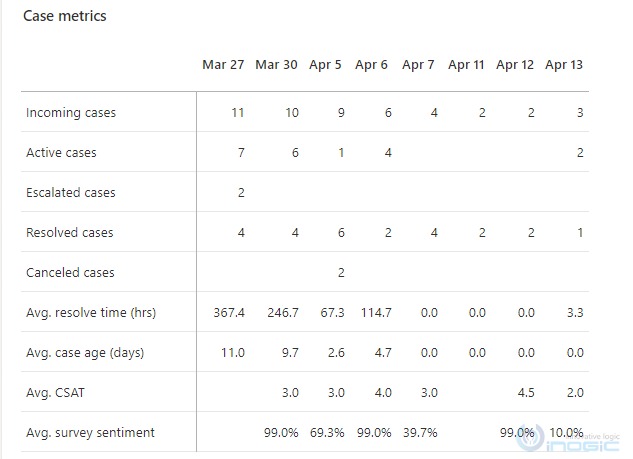
KPIs – KPIs displayed in the report are Incoming Cases, Active Cases, Escalated Cases, Avg. resolve time, Avg. CSAT, Avg. survey sentiment.
Metrics – Metrics displayed in the charts are Case volume by status, Open cases by priority, Incoming cases by channel, Open cases by age, Average CSAT trend, Average survey sentiment trend, Top 10 volume topics, and Emerging case volume by topic, Case metrics by channel, Case Metrics.
Filtering – You can filter information by selecting values from Duration, Channel, Queue, Agent, and Timezone. By default, the duration is set for the last 30 days.
2. Agent Dashboard- The Agent dashboard shows charts and KPIs for individual agents and overall agent performance. For more details refer this doc.
Navigate to the “Agent” dashboard as shown below:
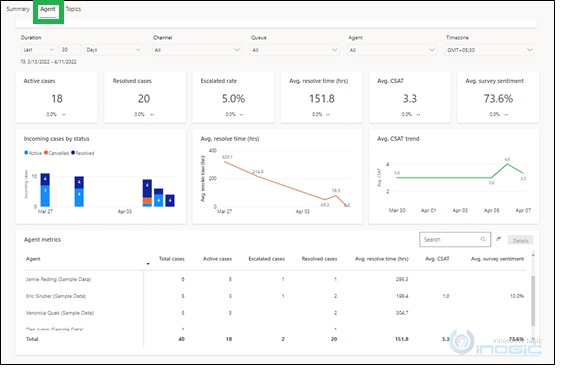
3. Topics Dashboard- The Topic dashboard shows a detailed breakdown of cases and their assigned topics. For more details refer this doc.
Navigate to the “Topics” dashboard as shown below:
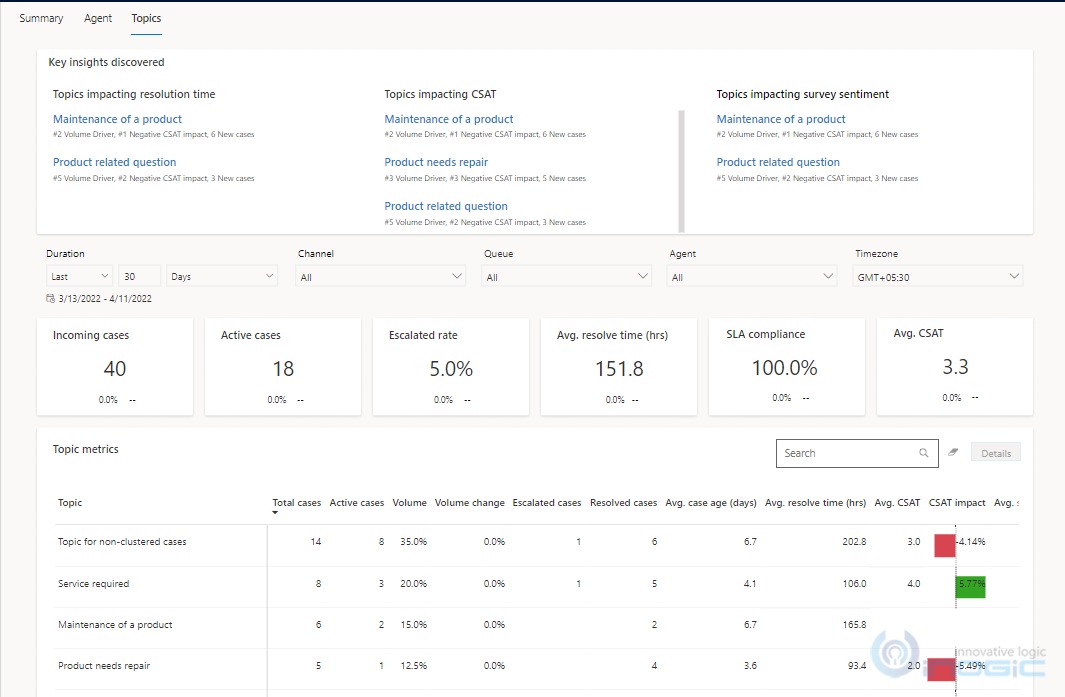
NOTE: With more appropriate data, the more accurate visibility/insights you will get in terms of KPI values and metrics on the dashboard.
Few things to keep in mind:
- This AI model needs an appropriate volume of cases related to similar topics for generating volume topics.
- Data Refresh happens after every 24 hours but the time when refresh is completed isn’t guaranteed. The “Last Updated” field at the topmost corner of the report shows when the last update happened.
- As of now the system updates the report automatically each day, starting at midnight UTC. There is no option to refresh the report manually.
Conclusion:
- The insights dashboards available in “Customer Service Historical Analytics” provide various charts and metrics that help the customer service manager to improve the customer service performance for the organization.
- Various key performance indicators (KPIs) and grouping of support cases with the AI-driven insights applied on cases, agents, and topics provide effective reporting and hence inbuilt accurate progress tracking capabilities.


 Like
Like Report
*This post is locked for comments