In the 10.0.30 release of D365FO, which went GA on Oct 21st 2022, Microsoft added the ability for customers to report on the telemetry data of their end users. I wanted to take a quick overview of this feature and start to look at opportunities to use this data.
Prerequisites
The telemetry data from Microsoft is stored in Azure Application Insights, so we have to create a resource for us to store this data in. Once created please note the Instrumentation Key as we will need that in subsequent steps.
How to Enable Telemetry
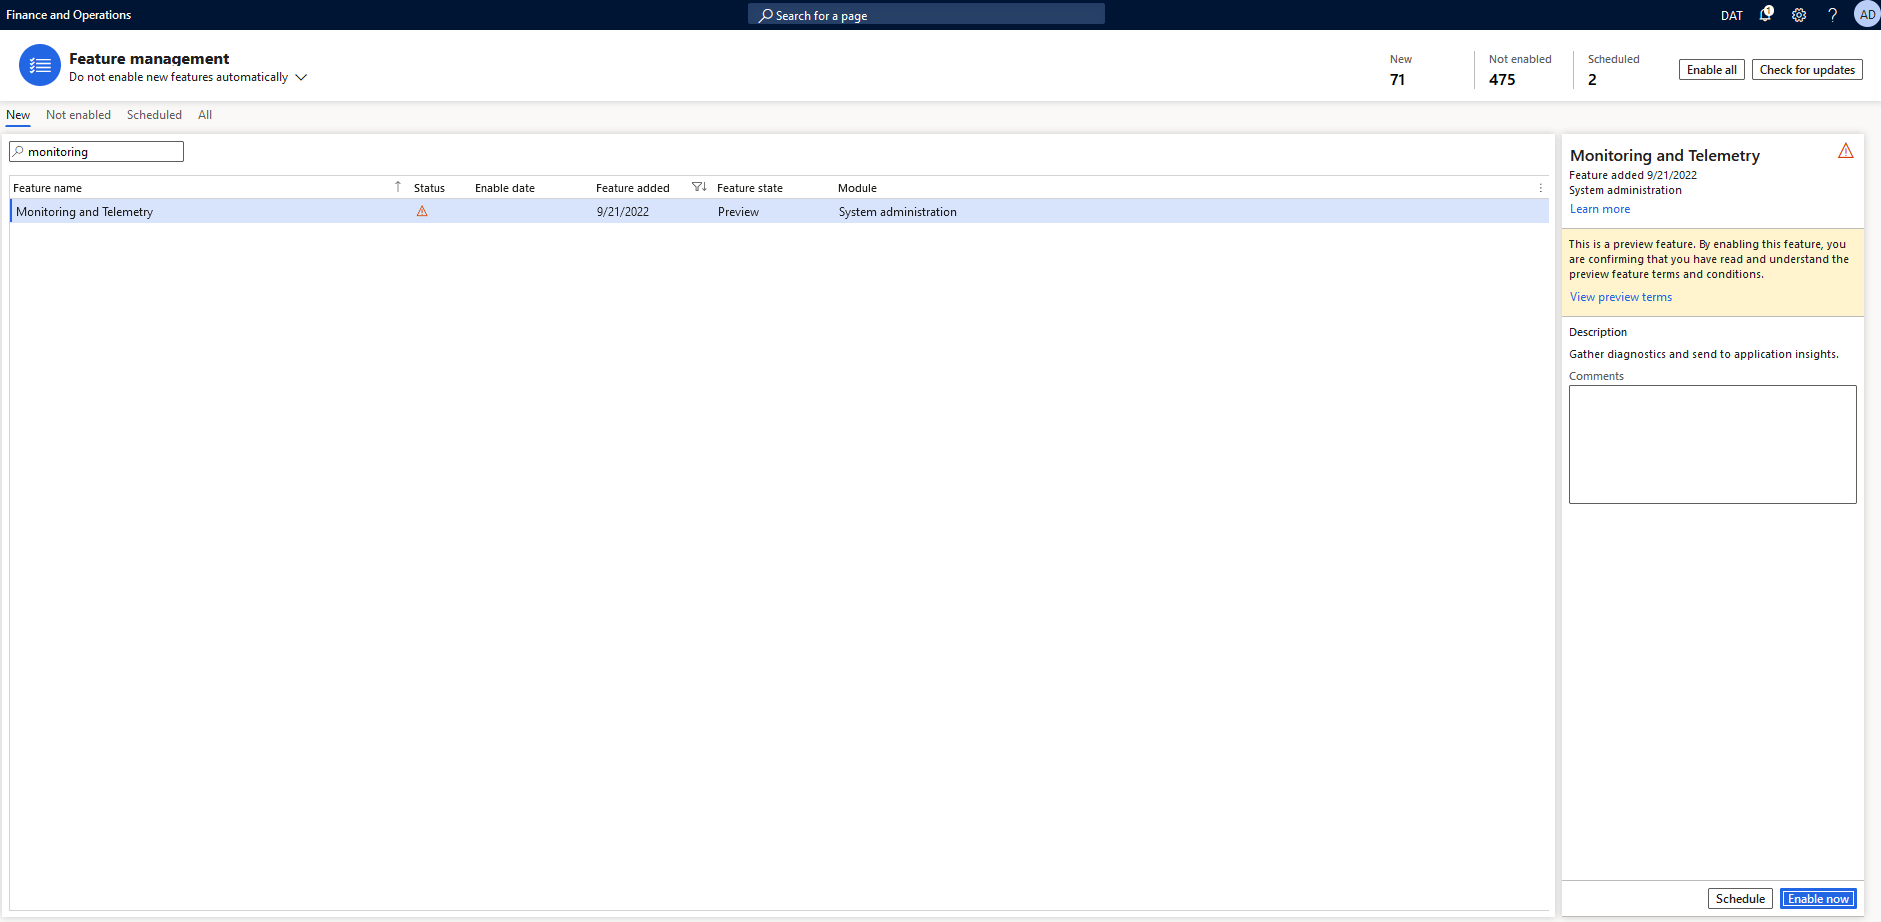
First and foremost, this feature is labeled as a ‘preview feature’ so it is not enabled by default so we have to navigate to System Administration -> Workspaces -> Feature Management and search for ‘monitoring and telemetry’. You can see the Status below is marked as the yellow triangle with exclamation point, indicating it is not enabled.
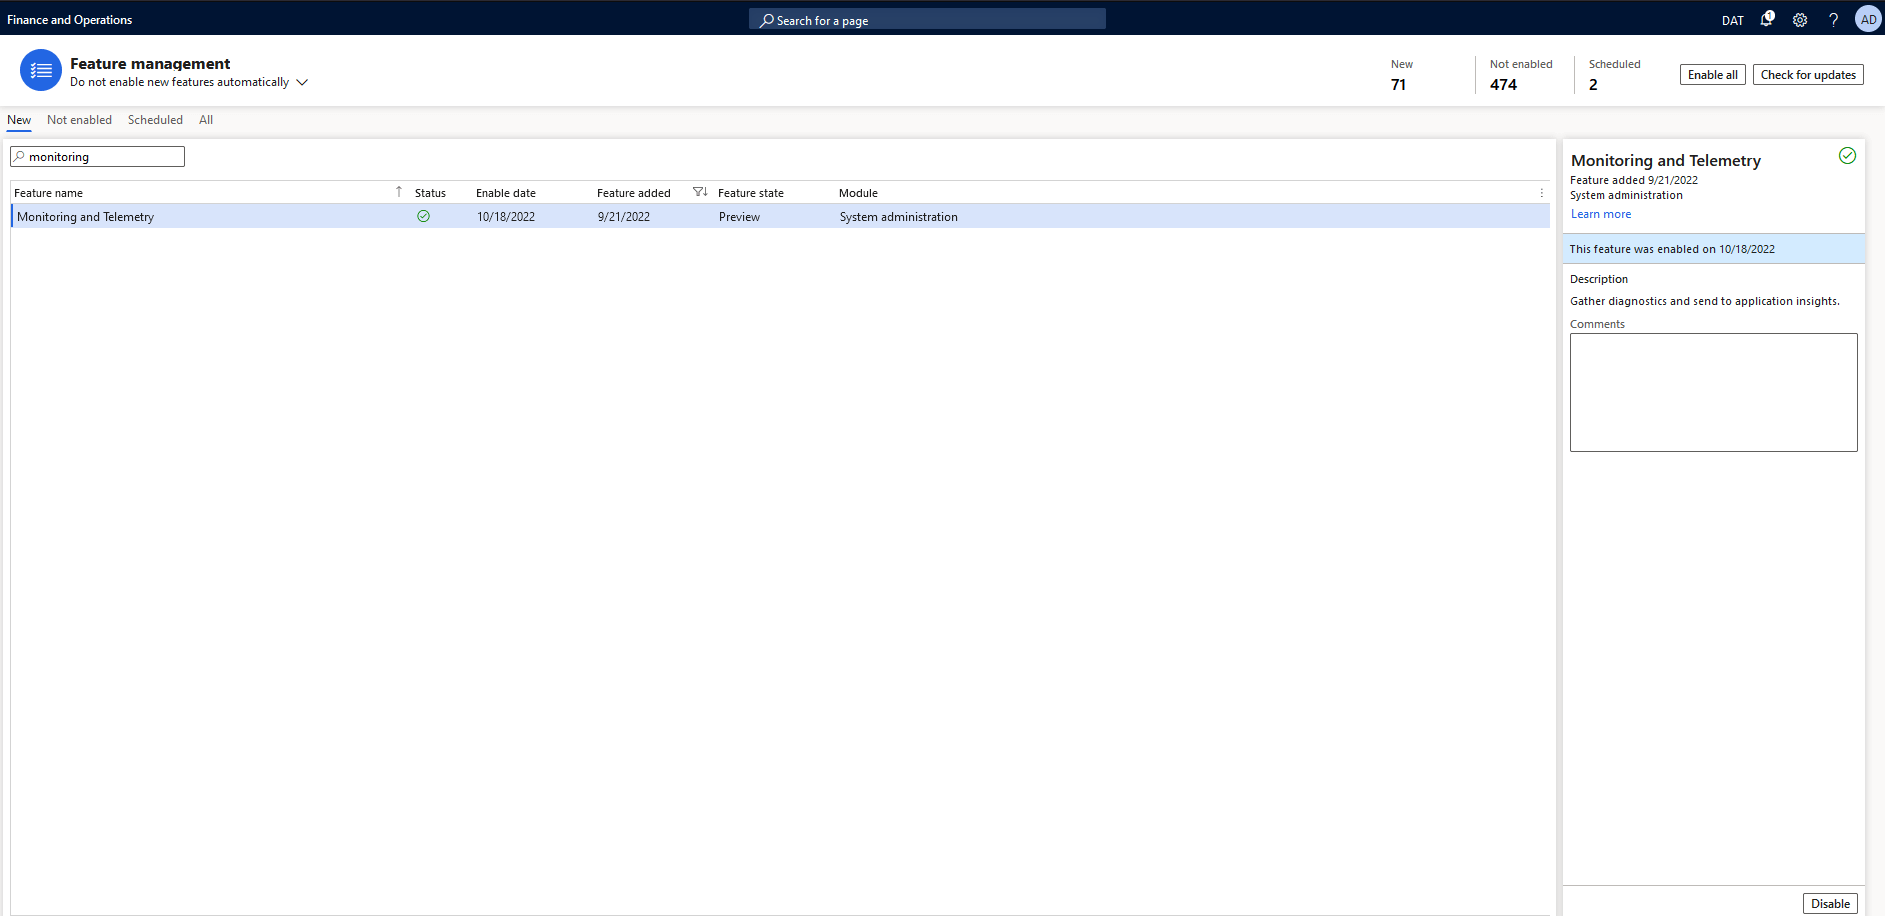
After enabling the feature, you can see the Status change to the green check mark.
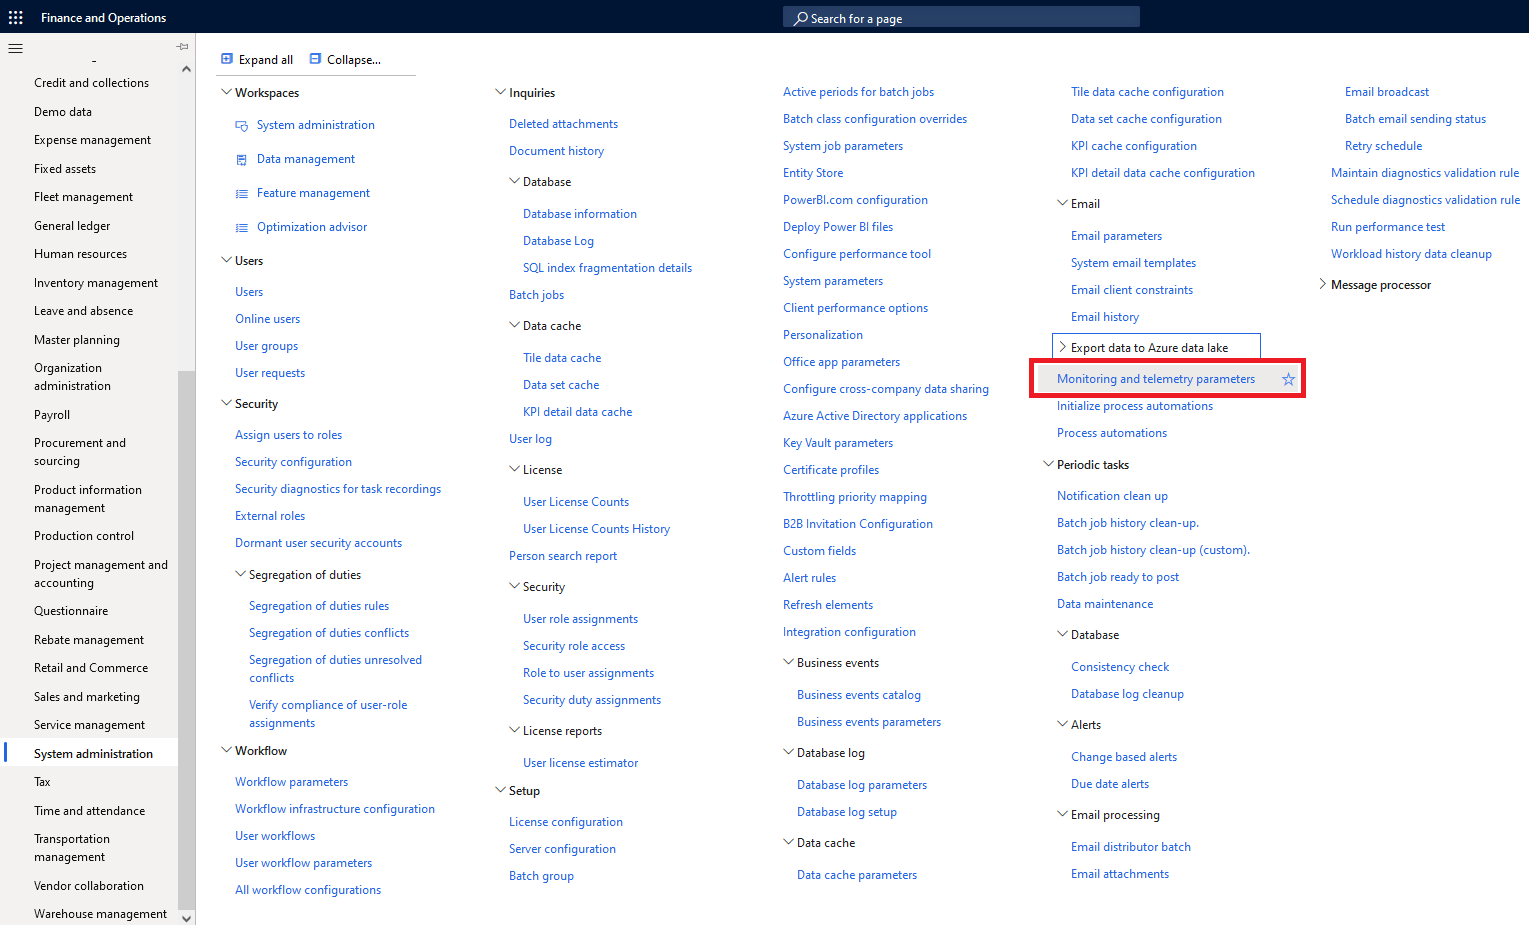
Now we can navigate to System Administration -> Setup -> Monitoring and Telemetry Parameters.
We can now configure which events we want to enable in the Configure tab, specifically for our case we want to enable the Form Runs, User Sessions, and X++ exceptions:
In the Environments tab, the LCS Environment variable is the Instrumentation Key from your Application Insights resource from the previous step. The Environment Mode should be set to whatever environment you want you are connecting to.
In the Application Insights Registry tab, we again will input our Environment Mode and Instrumentation key values.
Once these values are set, the configuration portion for telemetry data is complete.
Telemetry Data Reporting
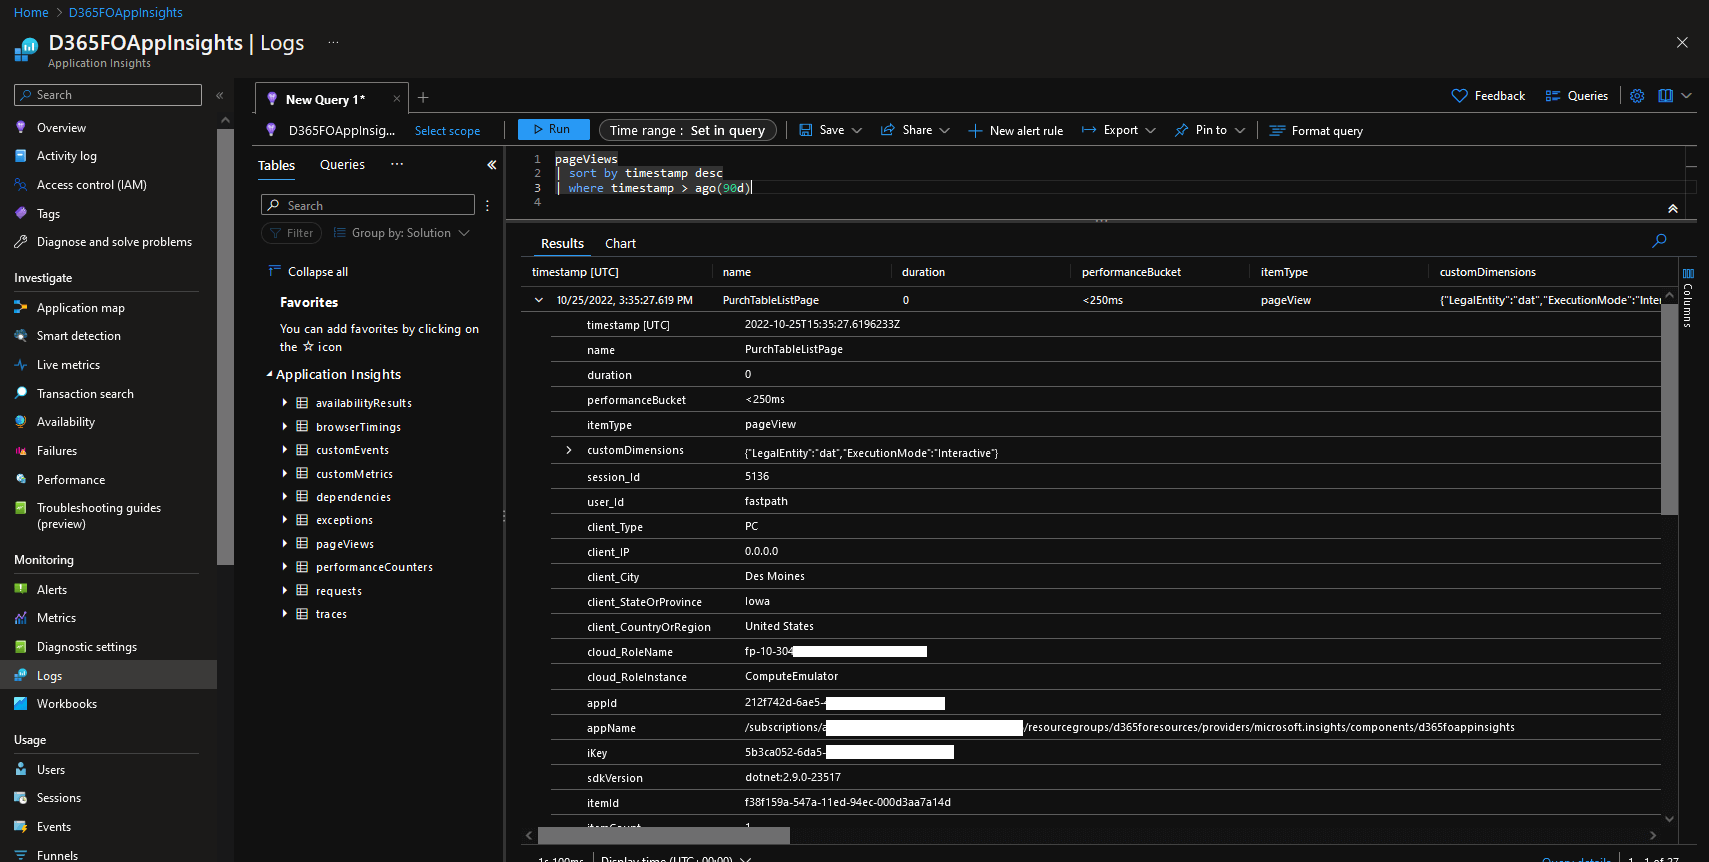
In the Application Insights resource we created initially within Azure, we can navigate to the Monitoring -> Logs area and see the tables available for us to query. The data in Application Insights can be queried using the Kusto Query Language (KQL). For example, in the screenshot below we can see we can query the ‘pageviews’ table to see all page views from users.
External Reporting
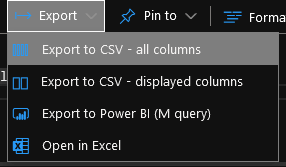
If we want to export the results of our KQL query we have a couple different options. The Export to CSV and Excel options are fairly standard, but one nice addition here is the ‘Export to Power BI’ option.
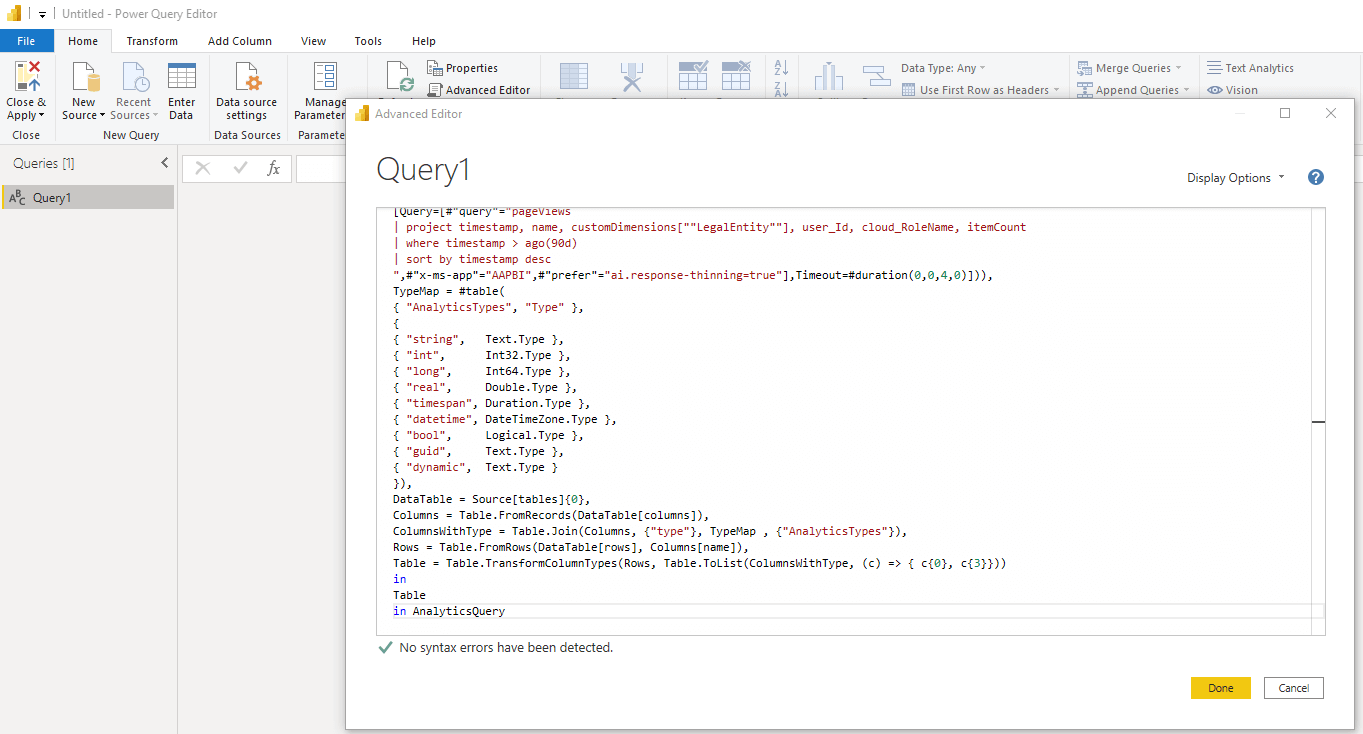
If we choose that option it exports a text file with the following instructions commented out at the top.
Follow the steps and copy the entire contents into an ‘Advanced Editor’ in PowerBI.
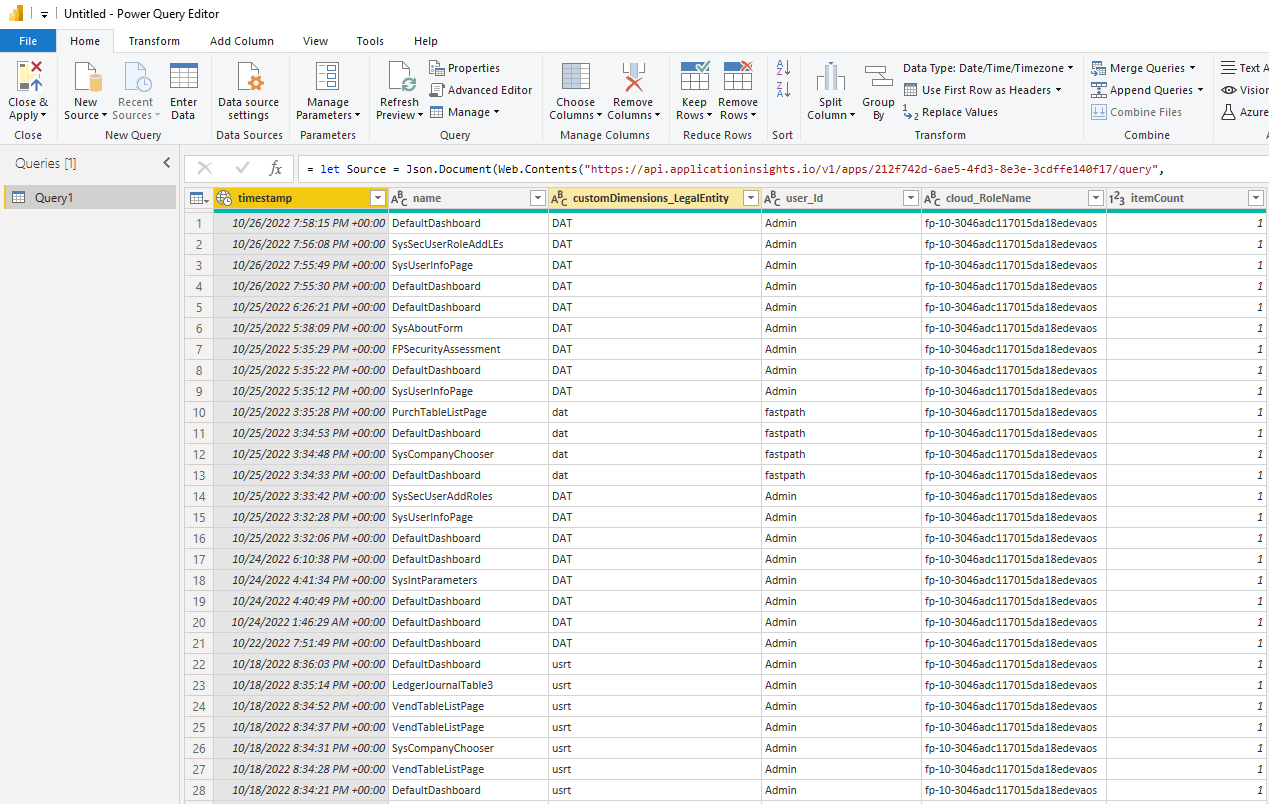
After authenticating, the PageViews table data is successfully pulled into PowerBI.
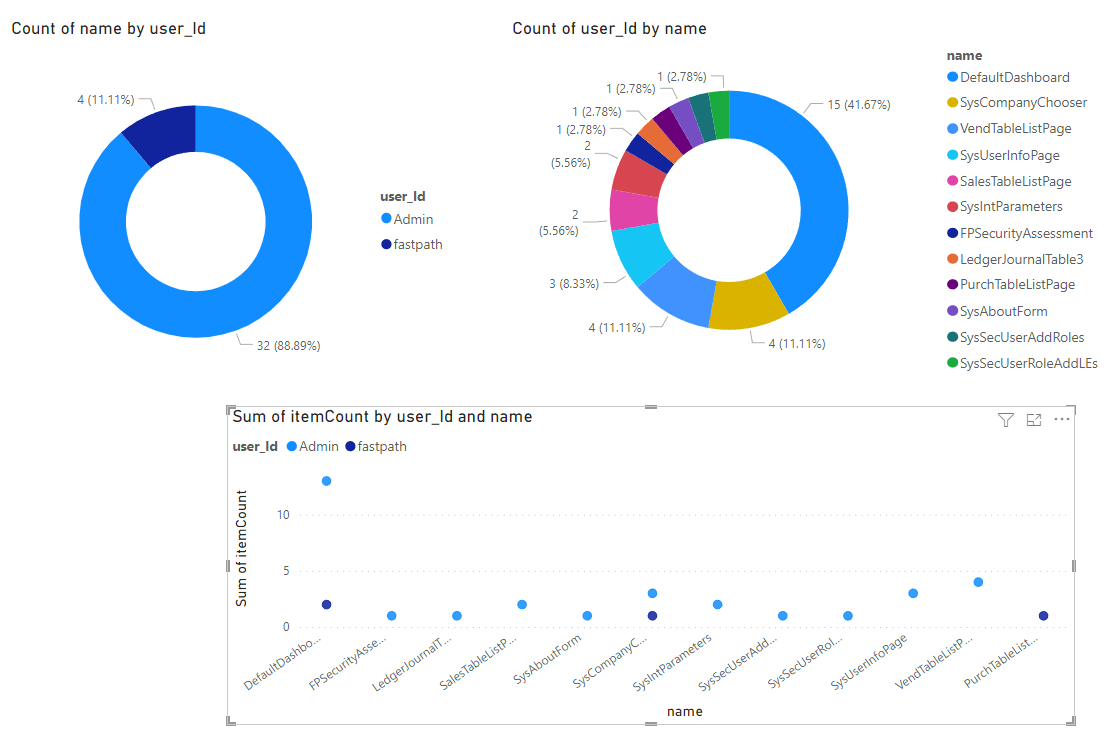
And we can create different PowerBI visualizations using this data.
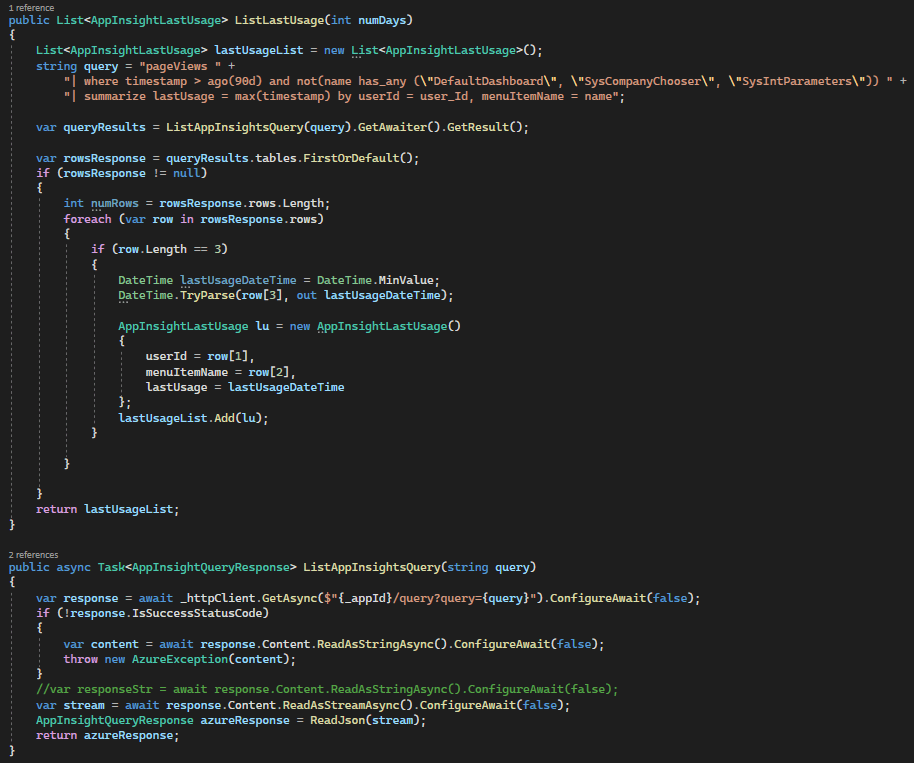
We can also access this data via an API call if you want to access this data externally the Application Insights API. There is an endpoint where we can execute a query we pass in which allows for us to do something like this:
Conclusion
Hopefully this overview was helpful on how to set up telemetry in your D365FO instance and the flexibility you have on accessing that data through a number of different options.
I have just scratched the surface into what this sort of data allows us to do, what cool features/functionality do you think we can make with this data?
The post Overview of Telemetry Data in D365FO appeared first on Alex Meyer.


 Like
Like Report



*This post is locked for comments