Power BI, Microsoft’s Data Analytical tool works with data and provides an enhanced view of data to take further actions for customer business improvement. Microsoft has provided lots of features to be used within Power BI which will help design effective and advanced Power BI reports and dashboards to have data overview at a single glance.
Recently, we came across one of its new features called Calculation Groups. This feature takes Power BI’s ability to understand and work with data to a whole new level, making it easier to do more complicated and personalized calculations.
In this blog, we’ll walk through to understand how we can use Calculation Groups to design improvised Power BI Reports.
Pre-requisites:
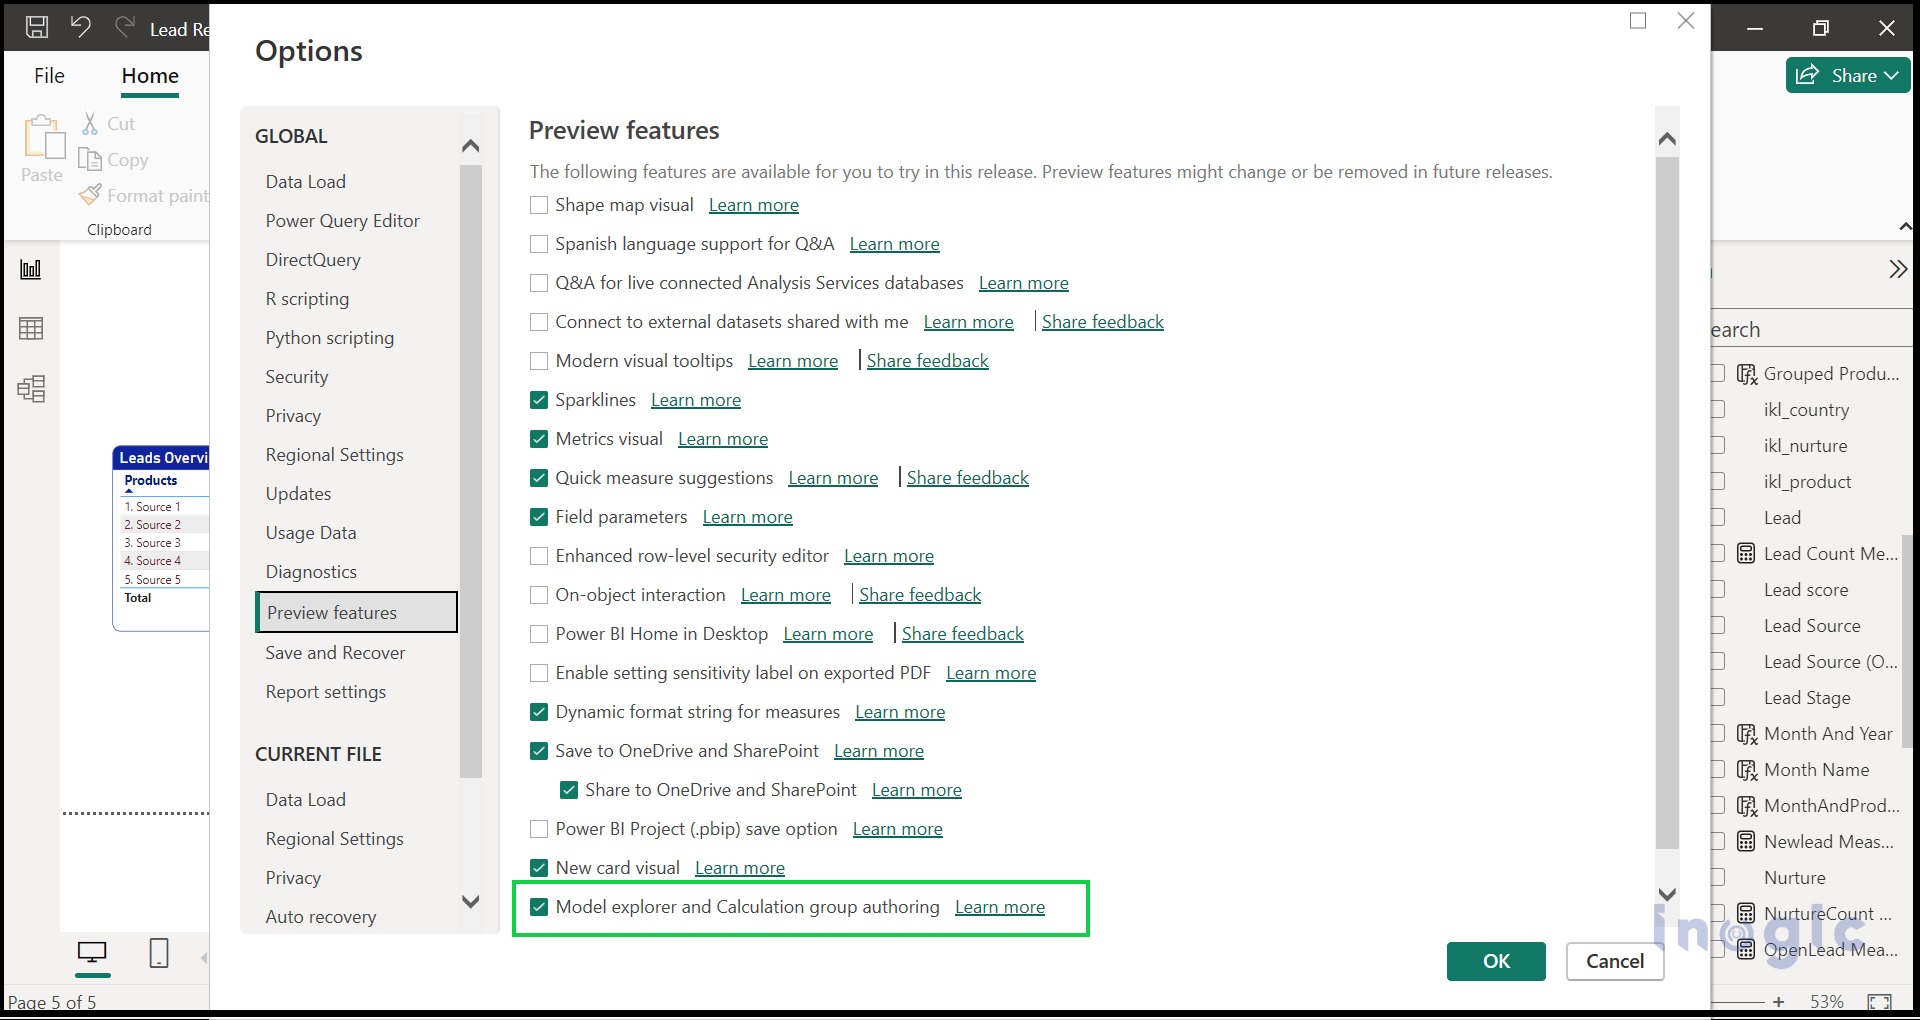
Before using the Power BI Calculation Group, we need to enable the Semantic Model from the preview features pane in Power BI.
1. Navigate to the settings,
2. Expand the Preview Features,
3. Enable the Modal Explorer and Calculation Group authoring
4. Click on “OK”
5. Restart the Power BI Desktop APP

6. After restarting the Power BI Desktop, Expand the Modal View in Power BI Desktop,

In the screenshot provided above, on the right side, there’s a “Model” tab that includes Semantic Models like Measures, Cultures, Roles, and more. The Calculation Group is a part of the Semantic Model.
Now, let’s demonstrate the use of the Calculation Group in one of our Power BI reports with a real-world use case scenario within the Power BI report. We will use calculation Groups to calculate the Lead Counts based on two aspects:… Read More »


 Like
Like Report
*This post is locked for comments