TL;DR: Visual Studio 2019 may crash during debug of X++ code. We are working to solve the problem: while we do that, you may work around the issue by selecting ‘Load symbols only for items in the solution’ in the debug settings. More details below:
As you may know we have been seeing some problems when developers use Visual Studio 2019 to debug X++ code. As you can imagine, fixing this issue is a priority for us.
We now know that the reason you are seeing crashes in the VS2019 debugging experience is that Visual Studio (VS) is reaching its memory limits. VS 2019 is a 32-bit application, and it can only address so much memory. The problems that cause random breakdowns and other issues are caused by memory pressure mainly due to the loading a lot of symbols contained in the PDB files. These are the files that contain the mapping between instruction pointers (offsets into the IL code) and information about which source code files and positions. This issue has been worsening due to the fact that our F&O application keeps growing, forcing the system to load more and bigger PDB files, impacting both stability and debugging performance. Other contributors for more memory consumptions are new features introduced in Visual Studio itself.
To reduce the probability of reaching the memory limit, we recommend fine tuning PDB files loading, loading as few as possible. One easy way to accomplish that is to select the “Load symbols only for items in the solution” as shown below:
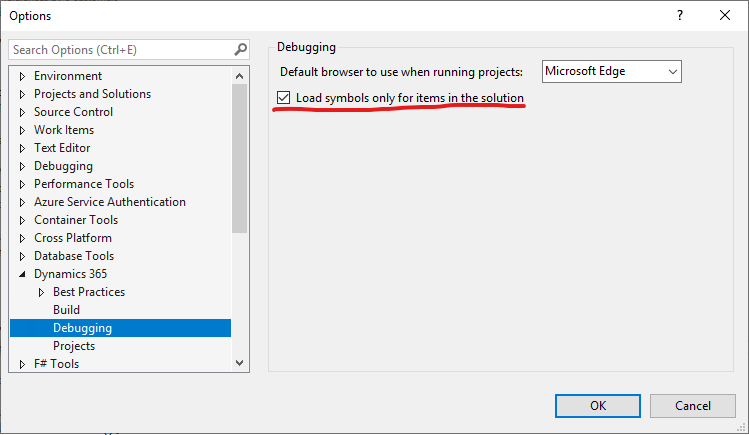
When this checkmark is checked only the PDBs for the code included in the solution are loaded. This provides a seamless experience for any code in your solution, as long as you don't step into something that is not part of the solution. When this happens, you can add the things you are interested in into your solution and restart your debugging session.
It is possible, though a little more complex, to avoid having to restart debugging by loading the symbols in the .dlls and .netmodules manually. This is done with the modules window in VS that you can open from the debug menu (or by using the Ctrl-Alt-U shortcut):
This window shows all the symbols and their status. In the case shown below the list is filtered with the Dynamics.AX prefix:
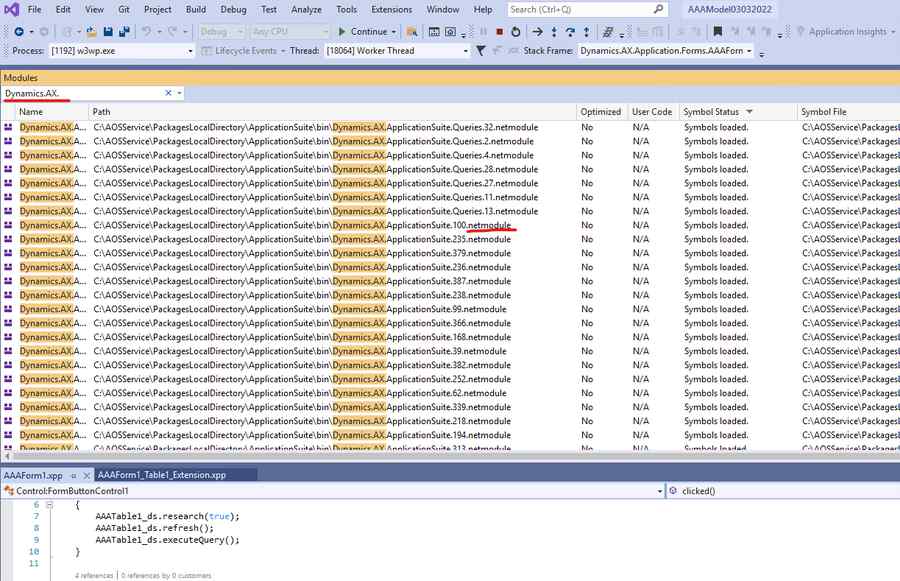
What you need to do is to apply the filter to find all artifacts in the package that you are interested in debugging and then using the context menu to "Load Symbols". Once you load all the netmodules for the package that you are interested in, you are good to go: You will be able to successfully step into methods, inspect variables etc.
It is true that the symbols are in the PDB files for the netmodules, not the DLLs, so, at least in principle, you should be able to pick exactly the netmodules that you need to debug and forget about the rest, which would improve your situation. We do not recommend that, since you would have to have detailed knowledge about what artifacts end in which netmodules. We see those things as implementation details that should not concern the user and are subject to change. For now, please let packages, including all the netmodules, be the unit of loading.
Now, it goes without saying: Load the only required number of assemblies and netmodules. The whole idea is to limit the memory pressure after all.
We are obviously not stopping here: We are working on several fronts to give you a better story. The long-term solution is to support VS 2022 that is a 64-bit application that does not suffer from these issues. This is something we must do, but it will take some time before we can deliver that. In the meantime we are working on a solution to allow you to do the symbols selection for those models you want to debug as part of the Dynamics AX debugging options window. We also have more arrows in our quiver and we will share those as results materialize.
Stay tuned for progress reports and please bear with us as we fix these issues.


 Like
Like Share
Share
 Report
 20
20
*This post is locked for comments