web
You’re offline. This is a read only version of the page.
close
Skip to main content

Announcements

No record found.

News and Announcements icon
Community site session details

Community site session details

Session Id :
Finance | Project Operations, Human Resources, ...
Answered

Cost control workspace configuration: statistical vs cost element dimension hierarchy

(0) ShareShare
ReportReport
Posted on by 1,419

Hi, 

When configuring a cost control workspace you can either choose a "Statistical dimension hierarchy" or a "Cost element dimension hierarchy", not both at the same time: 

pastedimage1610639736478v1.png

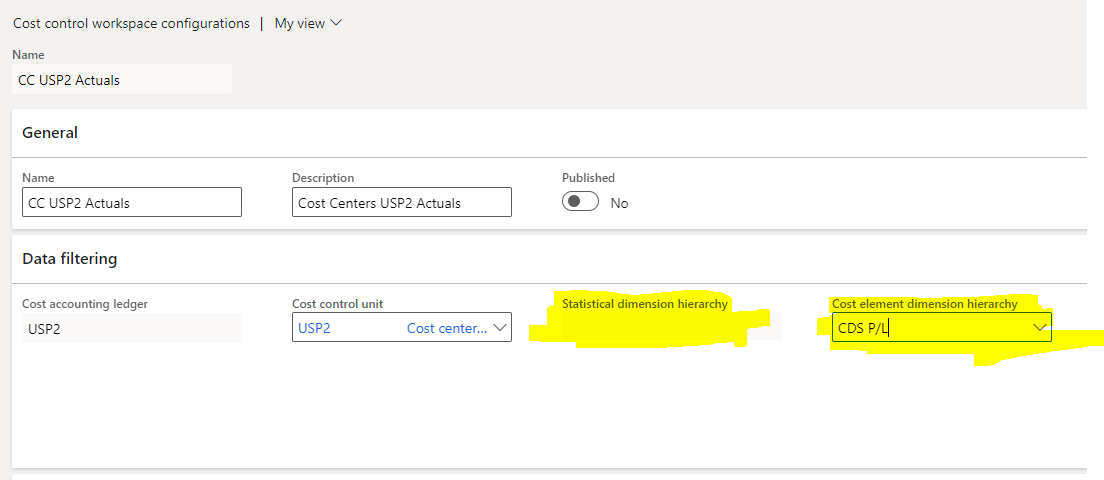
As the Microsoft documentation says: 

Cost control workspace configuration record can report either non-monetary or monetary values, but not in the same layout. Select a value in the Cost element dimension hierarchy field to report monetary values. Select a value in the Statistical dimension hierarchy field to report non-monetary values. The dimension hierarchy record that you select determines the structure of the reporting and aggregation levels.

I cannot think of a real life example of when the statistical dimension would be used, any ideas? 

I have the same question (0)
  • Ludwig Reinhard Profile Picture
    Microsoft Employee on at

    Hi CapsLock,

    What is it that you want to achieve there exactly?

    Do you want to draft a cost accounting report consisting of the cost elements, statistical elements and the cost control unit?

    How should this report look like, i.e. what data should it include and how do you want to present the data?

    Best regards,

    Ludwig

  • CapsLock Profile Picture
    1,419 on at

    Hi Ludwig,

    I don't to achieve nothing specific yet. I'm trying to understand the module and how much added value it can give to a particular organization. I'm trying to imagine how a workspace that is based on a statistical dimension would look like and what valuable information that can give us.

  • Verified answer
    Ludwig Reinhard Profile Picture
    Microsoft Employee on at

    Hi CapsLock, 

    You should be able to see the structure in the MS contoso environments. 

    Here is an example that I found. 

    The demo data for 2017 even show some outcome. 

    cac2.jpg

    Personally, I feel that the workspace does not add too much value as it gives you an overview only. 

    If you want to dig deeper and analyze the data then you will need to work with Excel or PowerBI. 

    Best regards, 

    Ludwig

Under review

Thank you for your reply! To ensure a great experience for everyone, your content is awaiting approval by our Community Managers. Please check back later.

Helpful resources

Quick Links

Introducing the 2026 Season 1 community Super Users

Congratulations to our 2026 Super Stars!

Meet the Microsoft Dynamics 365 Contact Center Champions

We are thrilled to have these Champions in our Community!

Congratulations to the April Top 10 Community Leaders

These are the community rock stars!

Leaderboard > Finance | Project Operations, Human Resources, AX, GP, SL

#1
Giorgio Bonacorsi Profile Picture

Giorgio Bonacorsi 804

#2
André Arnaud de Calavon Profile Picture

André Arnaud de Cal... 639 Super User 2026 Season 1

#3
Subra Profile Picture

Subra 528

Last 30 days Overall leaderboard

Product updates

Dynamics 365 release plans