Hello,
I have added options to the Stage Category global option set to reflect the phases on our business processes. The image below shows the options I have added to the option set.

I have included Eligibility (811130000), Documents Review (811130001), Placement Stage (811130002), DS 2019 Issuance (811130003), Visa and Arrival Information (811130004) and In-Country (811130005).
However when I open the pipeline I have created, I see these values in a random order. See below:
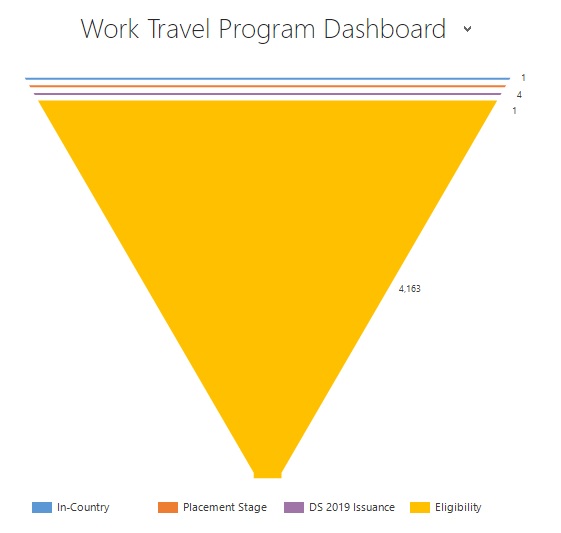
Can someone please help me figure out the order that has been setup and order this in either the order they show up in the global option set or by value number?
This is the XML file of the chart:
<visualization>
<visualizationid>{DA427BDB-2031-E811-80F4-0050569215AF}</visualizationid>
<name>Program Profile Sales Pipeline</name>
<primaryentitytypecode>aag_programprofile</primaryentitytypecode>
<datadescription>
<datadefinition>
<fetchcollection>
<fetch mapping="logical" aggregate="true">
<entity name="aag_programprofile">
<attribute name="aag_stagecategory" groupby="true" alias="_CRMAutoGen_groupby_column_Num_0" />
<attribute name="aag_programprofileid" aggregate="count" alias="_CRMAutoGen_aggregate_column_Num_0" />
</entity>
</fetch>
</fetchcollection>
<categorycollection>
<category alias="_CRMAutoGen_groupby_column_Num_0">
<measurecollection>
<measure alias="_CRMAutoGen_aggregate_column_Num_0" />
</measurecollection>
</category>
</categorycollection>
</datadefinition>
</datadescription>
<presentationdescription>
<Chart Palette="None" PaletteCustomColors="91,151,213; 237,125,49; 160,116,166; 255,192,0; 68,114,196; 112,173,71; 37,94,145; 158,72,14; 117,55,125; 153,115,0; 38,68,120; 67,104,43; 124,175,221; 241,151,90; 186,144,192; 255,205,51; 105,142,208; 140,193,104; 50,125,194; 210,96,18; 150,83,159; 204,154,0; 51,90,161; 90,138,57;">
<Series>
<Series ShadowOffset="0" IsValueShownAsLabel="True" Font="{0}, 9.5px" LabelForeColor="59, 59, 59" ChartType="Funnel" CustomProperties="FunnelLabelStyle=Outside, FunnelNeckHeight=0, FunnelPointGap=1, FunnelNeckWidth=5 ">
<SmartLabelStyle Enabled="True" />
</Series>
</Series>
<ChartAreas>
<ChartArea>
<Area3DStyle Enable3D="false" />
</ChartArea>
</ChartAreas>
<Legends>
<Legend Alignment="Center" LegendStyle="Table" Docking="right" IsEquallySpacedItems="True" Font="{0}, 11px" ShadowColor="0, 0, 0, 0" ForeColor="59, 59, 59" />
</Legends>
<Titles>
<Title Alignment="TopLeft" DockingOffset="-3" Font="{0}, 13px" ForeColor="0, 0, 0" />
</Titles>
</Chart>
</presentationdescription>
<isdefault>false</isdefault>
</visualization>


