web
You’re offline. This is a read only version of the page.
close
Skip to main content

Notifications

Announcements

No record found.

Community site session details

Community site session details

Session Id :
Microsoft Dynamics CRM (Archived)

Ordering a stacked column chart based on two option calculated field

(0) ShareShare
ReportReport
Posted on by

Hi,

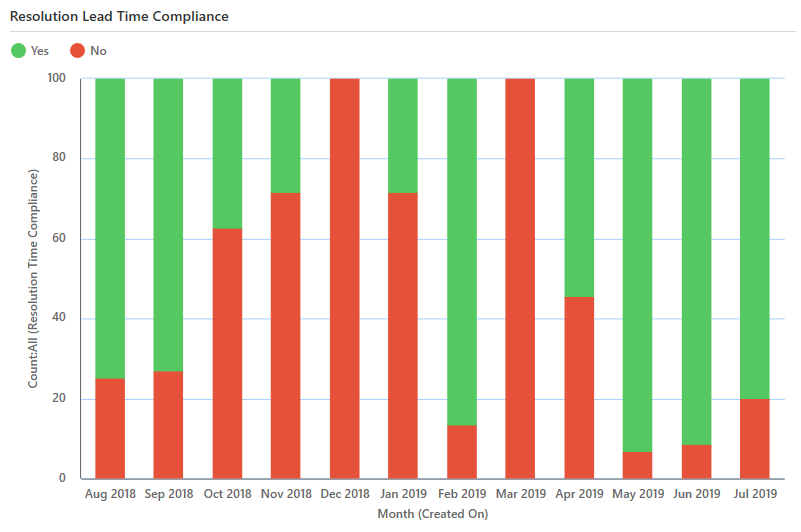
I'm trying to switch the order of my 100% stacked column chart based on a custom calculated field I created (resolutiontimecompliance).
This calculated field has two options ("yes" = 1 and "no" = 0).

Simply put, I'd like to switch the data of green and red in this chart:
pastedimage1566211031501v1.png
I've tried to do this using the following code, but it does not work.


 <fetchcollection>
        <fetch aggregate="true" mapping="logical">
          <entity name="incident">
            <attribute name="createdon" alias="_CRMAutoGen_groupby_column_Num_0" groupby="true" dategrouping="month" />
            <attribute name="resolutiontimecompliance" aggregate="count" alias="_CRMAutoGen_aggregate_column_Num_0" />
            <attribute name="resolutiontimecompliance" alias="complianceyesno" groupby="true" />
     <order alias="complianceyesno" descending="true" />
     <filter>
            <condition value="365" operator="last-x-days" attribute="createdon" />
            </filter> 
  </entity>
        </fetch>
      </fetchcollection>


Any help with this would be much appreciated!

*This post is locked for comments

I have the same question (0)
  • LuHao Profile Picture
    40,892 on at

    Hi Nina,

    In the XML of the chart, you need to swap two lines of code. 

    First find the <categorycollection></categorycollection> tag.

    Suppose the original xml code block looks like this:

    <categorycollection>
        <category alias="_CRMAutoGen_groupby_column_Num_0">
            <measurecollection>
                <measure alias="CRM_Yes" />
            </measurecollection>
            <measurecollection>
                <measure alias="CRM_No" />
            </measurecollection>
        </category>
    </categorycollection>

    Change the position of the two 'measure alias'.

    After modification, it becomes like this:

    <categorycollection>
        <category alias="_CRMAutoGen_groupby_column_Num_0">
            <measurecollection>
                <measure alias="CRM_No" />
            </measurecollection>
            <measurecollection>
                <measure alias="CRM_Yes" />
            </measurecollection>
        </category>
    </categorycollection>

    After modification, export this xml file to D365.

  • Community Member Profile Picture
    on at

    Hi Lu Hao,

    First of all, thanks a lot for taking the time to help me out with my questions. Sorry for not sharing the full code, I was convinced the problem was in the top part.

    I tried your solution, but the original xml block as you describe it does not exist in my code; there is only one measure alias and therefore there's nothing to switch.

    Any chance you can help me out further?

    Best regards,

    Nina

      <datadefinition>

         <fetchcollection>

           <fetch aggregate="true" mapping="logical">

             <entity name="incident">

               <attribute name="createdon" alias="_CRMAutoGen_groupby_column_Num_0" groupby="true" dategrouping="month" />

               <attribute name="resolutiontimecompliance" aggregate="count" alias="_CRMAutoGen_aggregate_column_Num_0" />

               <attribute name="resolutiontimecompliance" alias="complianceyesno" groupby="true" />

        <order alias="complianceyesno" descending="true" />

        <filter>

               <condition value="365" operator="last-x-days" attribute="createdon" />

               </filter>  

     </entity>

           </fetch>

         </fetchcollection>

         <categorycollection>

           <category alias="_CRMAutoGen_groupby_column_Num_0">

             <measurecollection>

               <measure alias="_CRMAutoGen_aggregate_column_Num_0" />

             </measurecollection>

           </category>

         </categorycollection>

       </datadefinition>

  • LuHao Profile Picture
    40,892 on at

    Hi Nina,

    In my opinion, this is impossible.

    I tried a lot of methods, but if there is only one field in this chart, then it can't sort the data source.

  • Community Member Profile Picture
    on at

    Hi Lu Hao,

    Okay, thanks for trying to help out! I can't imagine this to be impossible so I'm not giving up just yet :)

    Kind regards,

    Nina

  • LuHao Profile Picture
    40,892 on at

    Hi partner,

    Is your problem solved? Are there any other questions?

    Please don't forget to close this theme by clicking Yes to mark the verified answer.

    pastedimage1566893162444v1.png

    This will help other users quickly navigate to this theme.

    Thanks.  :)

  • Community Member Profile Picture
    on at

    Hi,

    Thanks for the reminder. Unfortunately my problem has not been resolved yet, so I clicked "No".

    Kind regards,

    Nina

Under review

Thank you for your reply! To ensure a great experience for everyone, your content is awaiting approval by our Community Managers. Please check back later.

Helpful resources

Quick Links

Responsible AI policies

As AI tools become more common, we’re introducing a Responsible AI Use…

Neeraj Kumar – Community Spotlight

We are honored to recognize Neeraj Kumar as our Community Spotlight honoree for…

Leaderboard > 🔒一 Microsoft Dynamics CRM (Archived)

#1
SA-08121319-0 Profile Picture

SA-08121319-0 4

#1
Calum MacFarlane Profile Picture

Calum MacFarlane 4

#3
Alex Fun Wei Jie Profile Picture

Alex Fun Wei Jie 2

Last 30 days Overall leaderboard

Featured topics

Product updates

Dynamics 365 release plans