web
You’re offline. This is a read only version of the page.
close
Skip to main content

Notifications

Announcements

No record found.

Community site session details

Community site session details

Session Id :
Microsoft Dynamics AX (Archived)

ServerEvalFunc in Trace parser shows more Inclusive Time

(0) ShareShare
ReportReport
Posted on by

Hello Everyone,

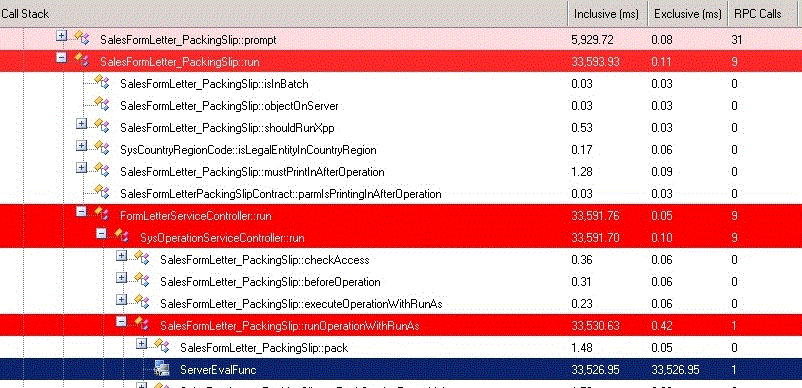
I have imported trace file in trace parser and it shows that ServerEvalFunc is taking more time 33526.95 ms as shown in blue in below image.

It's generated from Delivery Posting process in Inventory.

Can you please guide where i have to look into? There is no any database call here.
*This post is locked for comments

I have the same question (0)
  • Martin Dráb Profile Picture
    237,987 Most Valuable Professional on at

    What's the X++ code in question?

  • Community Member Profile Picture
    on at

    it's just the standard ax functionality.

  • Martin Dráb Profile Picture
    237,987 Most Valuable Professional on at

    You would have a better chance to get an answer if you made it easier for others and provided more information. It also gives an impression that you haven't bothered to analyze your own problem.

    If you say "it's just the standard ax functionality", which exact version are you talking about? I might do the job for you and post the code here, but if you're not using AX 2012 R3, there is a risk that we won't be looking at the same.

  • Community Member Profile Picture
    on at

    It's ax 2012 R2 version. Do you need any more details?

  • Martin Dráb Profile Picture
    237,987 Most Valuable Professional on at

    I don't need anything. You need to identify which call it is.

    Your trace shows that SysOperationServiceController.runOperationWithRunAs() executes SalesFormLetter_PackingSlip.pack() on server, but you have no idea what happens on server. You should switch the the corresponding server session to see calls from pack() and identify which one is causing the problem. If you didn't collect server trace, you'll have to do an additional recording. Also ensure that you're collecting appropriate events (e.g. Xpp parameters may give you useful information).

    Until you identify the exact place, you can't fix anything.

  • Suggested answer
    Denis Patrakov Profile Picture
    on at

    You must be running business logic in CIL (see Tools/Options/Development/Execute business operations in CIL checkbox) - in that case you can't use Trace Parcer to see what was going on during execution in CIL, and all the posting process appears as a single ServerEvalFunc call. You have to clear the checkbox and run the posting again to get the timings and to see the actual call tree. But the timings might be slightly different then in CIL.

Under review

Thank you for your reply! To ensure a great experience for everyone, your content is awaiting approval by our Community Managers. Please check back later.

Helpful resources

Quick Links

Responsible AI policies

As AI tools become more common, we’re introducing a Responsible AI Use…

Neeraj Kumar – Community Spotlight

We are honored to recognize Neeraj Kumar as our Community Spotlight honoree for…

Leaderboard > 🔒一 Microsoft Dynamics AX (Archived)

#1
Martin Dráb Profile Picture

Martin Dráb 4 Most Valuable Professional

#1
Priya_K Profile Picture

Priya_K 4

#3
MyDynamicsNAV Profile Picture

MyDynamicsNAV 2

Last 30 days Overall leaderboard

Featured topics

Product updates

Dynamics 365 release plans