web
You’re offline. This is a read only version of the page.
close
Skip to main content

Notifications

Announcements

No record found.

Community site session details

Community site session details

Session Id :
Microsoft Dynamics CRM (Archived)

Adding Totals to a Chart and/or Dashboard

(0) ShareShare
ReportReport
Posted on by

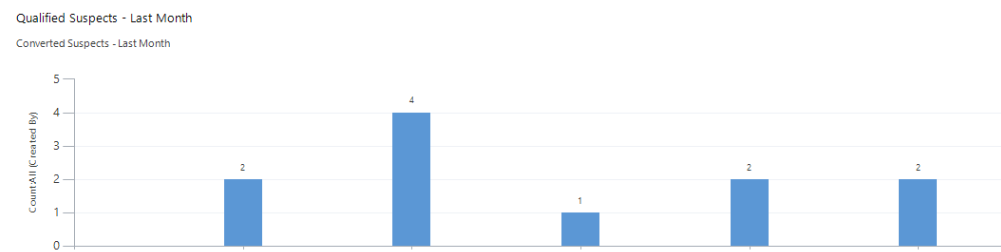
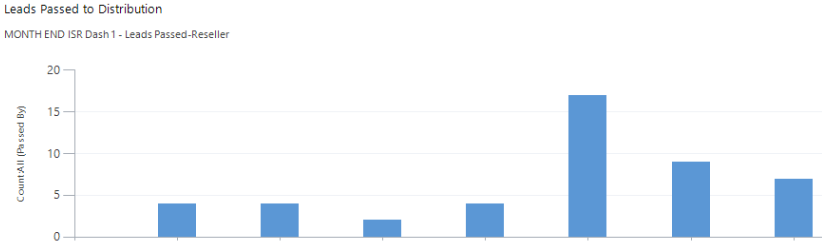
I created a dashboard for my team today that includes several charts.  I created each of the charts the same way, but some of them have a total at the top, and some do not.  As you can see in the screenshots below, the first one has totals at the top of the bar, and the second one doesn't.  I feel like I am missing an Advanced Setting someplace, but I dont see anywhere to click for additional settings/options.  

Any help would be fantastic.  

QS.PNG

LP.PNG

*This post is locked for comments

I have the same question (0)
  • Community Member Profile Picture
    on at

    Not sure if this is a setting in CRM 2015. However, you could edit the chart's RDL file to remove/add the series values. Just look for the <series> tag and edit the following;

    IsValueShownAsLabel="False"

    Obviously 'False" hides the figures and "True" shows them.

  • Community Member Profile Picture
    on at

    I actually have no idea what that means.  I tried googling it, and played around with it for awhile, but I'm not a programmer, and I don't know anything about SQL.  

    Is there any way to accomplish this inside the CRM?

  • Suggested answer
    Robert Wittig Profile Picture
    1,885 on at

    CJAdams,

    You do not need to know how to do anything with SQL or a developer to alter the charts.  That being said a logical mind helps.

    I would first start by reading through this blog:  crmchartguy.wordpress.com/ms-crm-chart-editor-and-xml-overview it has a nice overview on how to perform more advanced versions of charts.

    Then when you are ready, you can download the chart XML as instructed by the blog and find the IsValueShownAsLabel property in the XML.  You will then edit that property to true save the file and reupload into Dynamics CRM like instructed in the Blog.

    All in all the process is very simple but and can seem overwhelming when looking at all the XML in the file.  I would recommend playing with this in a development environment before moving it into a production environment.

    Good Luck!

    PS I should note, the crmchartguy has some really good blogs on his blog about altering charts to make some pretty amazing things, so if you are looking how to really make charts stand out, you can find some valuable info there.

  • Community Member Profile Picture
    on at

    Thanks for the link, this blog does seem to make it a bit easier to understand.  I read through the link, and I think this is something I can pull off without blowing our CRM up in the process.  Im downloading Notepad++ as instructed in the blog, and will try to make these changes on Monday.  

  • Robert Wittig Profile Picture
    1,885 on at

    Good luck!

  • Community Member Profile Picture
    on at

    My apologies, I probably skipped a few steps.

    Yes, the blog suggested by Robert Wittig is an excellent start. It is exactly where I learned the basics of editing charts.

Under review

Thank you for your reply! To ensure a great experience for everyone, your content is awaiting approval by our Community Managers. Please check back later.

Helpful resources

Quick Links

Responsible AI policies

As AI tools become more common, we’re introducing a Responsible AI Use…

Neeraj Kumar – Community Spotlight

We are honored to recognize Neeraj Kumar as our Community Spotlight honoree for…

Leaderboard > 🔒一 Microsoft Dynamics CRM (Archived)

#1
SA-08121319-0 Profile Picture

SA-08121319-0 4

#1
Calum MacFarlane Profile Picture

Calum MacFarlane 4

#3
Alex Fun Wei Jie Profile Picture

Alex Fun Wei Jie 2

Last 30 days Overall leaderboard

Featured topics

Product updates

Dynamics 365 release plans