Is there a way in CRM to create a chart (either through XML modification or natively) that will allow to cumulative values in a series (shown in image below, It's just a sample image for desired result)?
feb 01 2017 = $15,000 becomes feb 01 2017 = $15,000
feb 02 2017 = $7,000 becomes feb 02 2017 =$22,000
feb 03 2017 = $20,000 becomes feb 03 2017 = $42, 000
feb 04 2017 = $15,000 becomes feb 04 2017 = $57,000
feb 05 2017 = $7,000 becomes feb 05 2017 =$64,000
feb 06 2017 = $20,000 becomes feb 06 2017 = $84, 000
feb 07 2017 = $20,000 becomes feb 07 2017 = $104, 000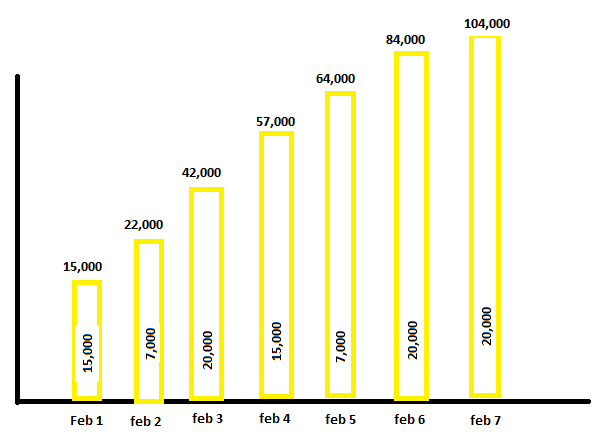
*This post is locked for comments
I have the same question (0)


