Hi,
I'm trying to visualize the resolution time of cases over time and I'd like to show this graph for three different case priority levels.
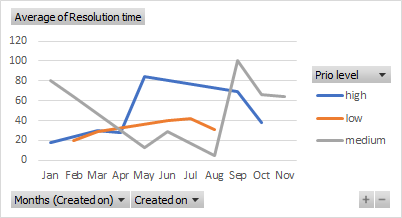
I made a quick visualization in Excel to clarify exactly what I want to make:
I've been trying to apply filters to each of the different legend entries (with the help of crmchartguy.com/.../) but I haven't been able to get it to work.
My starting point is the xml code of the chart with three times the same legend entry (resolution time), see below. I've renamed the aliases to something easier to work with.
In summary, I'd like a different filter to be applied to each line in the chart, one with prioritycode="0" (low), prioritycode="1" (medium) and prioritycode="2" (high).
Any help with this would be very much appreciated!
<visualization>
<visualizationid>{849E0676-2AB8-E911-A863-000D3AB0DC71}</visualizationid>
<name>AA_Nina_Avg Case Resolution Time over Time</name>
<description>Shows the average resolution time in minutes (Trend Line) along with the number of cases resolved (Column Chart) per day.</description>
<primaryentitytypecode>incident</primaryentitytypecode>
<datadescription>
<datadefinition>
<fetchcollection>
<fetch mapping="logical" aggregate="true">
<entity name="incident">
<link-entity name="incidentresolution" from="incidentid" to="incidentid" link-type="inner">
<filter>
<condition value="1" attribute="statecode" operator="eq" />
</filter>
</link-entity>
<attribute name="createdon" alias="groupby_column" groupby="true" dategrouping="month" />
<attribute name="ai_resolutiontime" aggregate="avg" alias="restimelowprio" />
<attribute name="ai_resolutiontime" aggregate="avg" alias="restimemedprio" />
<attribute name="ai_resolutiontime" aggregate="avg" alias="restimehighprio" />
</entity>
</fetch>
</fetchcollection>
<categorycollection>
<category alias="groupby_column">
<measurecollection>
<measure alias="restimelowprio" />
</measurecollection>
<measurecollection>
<measure alias="restimemedprio" />
</measurecollection>
<measurecollection>
<measure alias="restimehighprio" />
</measurecollection>
</category>
</categorycollection>
</datadefinition>
</datadescription>
*This post is locked for comments
I have the same question (0)


