Right.. I don't need aggregates at the moment since they can just hover over to see those values.
I followed Adam's advice and removed the YAxis="Secondary" component and my graph now looks like this.
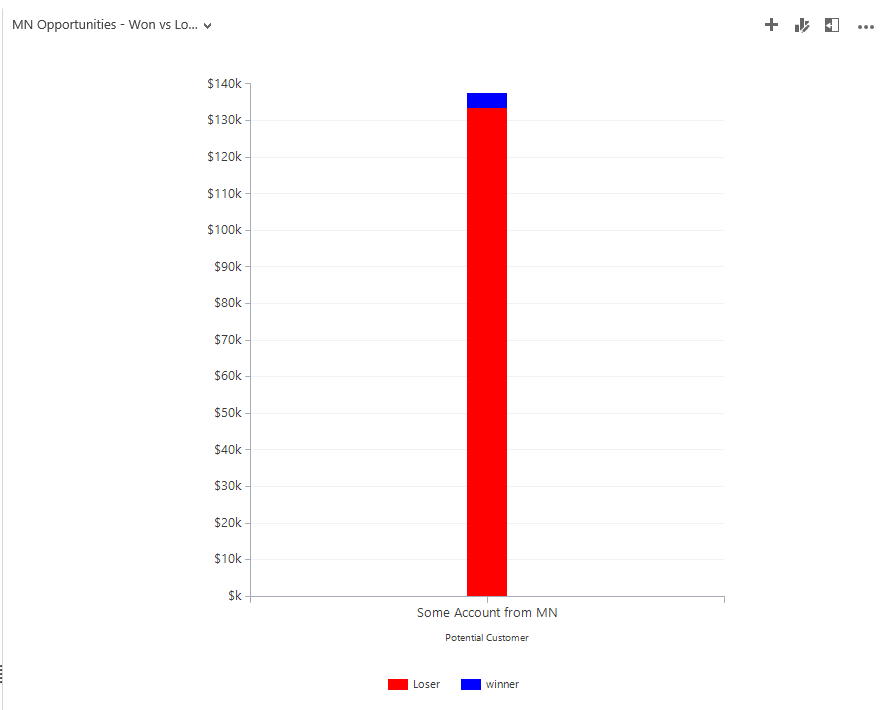
So I want it to look like Mamatha's picture, which it now does not. Also, the graph is wrong... I had one oppty with $133k *won* and one with $4k lost. Yet the red part (Loser) is amounting to $133k and the winner is $4k, so its backwards.
Here is my XML, any help appreciated. Thanks.
<visualization>
<visualizationid>{B35583E8-96DF-E411-80D6-C4346BACC97C}</visualizationid>
<name>MN Opportunities - Won vs Lost</name>
<primaryentitytypecode>opportunity</primaryentitytypecode>
<datadescription>
<datadefinition>
<fetchcollection>
<fetch mapping="logical" aggregate="true">
<entity name="opportunity">
<attribute groupby="true" alias="wonvlost" name="customerid" />
<link-entity name="opportunity" from="opportunityid" to="opportunityid" link-type="outer">
<attribute alias="won" name="actualvalue" aggregate="sum" />
<filter>
<condition attribute="statecode" operator="eq" value="Won" />
</filter>
</link-entity>
<link-entity name="opportunity" from="opportunityid" to="opportunityid" link-type="outer">
<attribute alias="lost" name="actualvalue" aggregate="sum" />
<filter>
<condition attribute="statecode" operator="eq" value="Lost" />
</filter>
</link-entity>
</entity>
</fetch>
</fetchcollection>
<categorycollection>
<category alias="wonvlost">
<measurecollection>
<measure alias="won" />
</measurecollection>
<measurecollection>
<measure alias="lost" />
</measurecollection>
</category>
</categorycollection>
</datadefinition>
</datadescription>
<presentationdescription>
<Chart Palette="None" PaletteCustomColors="91,151,213; 237,125,49; 160,116,166; 255,192,0; 68,114,196; 112,173,71; 37,94,145; 158,72,14; 117,55,125; 153,115,0; 38,68,120; 67,104,43; 124,175,221; 241,151,90; 186,144,192; 255,205,51; 105,142,208; 140,193,104; 50,125,194; 210,96,18; 150,83,159; 204,154,0; 51,90,161; 90,138,57;">
<Series>
<Series ChartType="StackedColumn" LegendText="Loser" Color="red" IsValueShownAsLabel="False" Font="{0}, 9.5px" LabelForeColor="59, 59, 59" CustomProperties="PointWidth=0.75, MaxPixelPointWidth=40"></Series>
<Series ChartType="StackedColumn" LegendText="winner" Color="blue" IsValueShownAsLabel="False" Font="{0}, 9.5px" LabelForeColor="59, 59, 59" CustomProperties="PointWidth=0.75, MaxPixelPointWidth=40"></Series>
</Series>
<ChartAreas>
<ChartArea BorderColor="White" BorderDashStyle="Solid">
<AxisY LabelAutoFitMinFontSize="8" TitleForeColor="59, 59, 59" TitleFont="{0}, 10.5px" LineColor="165, 172, 181" IntervalAutoMode="VariableCount">
<MajorGrid LineColor="239, 242, 246" />
<MajorTickMark LineColor="165, 172, 181" />
<LabelStyle Font="{0}, 10.5px" Format="$#,#,k" ForeColor="59, 59, 59" />
</AxisY>
<AxisX LabelAutoFitMinFontSize="8" TitleForeColor="59, 59, 59" TitleFont="{0}, 10.5px" LineColor="165, 172, 181" IntervalAutoMode="VariableCount">
<MajorTickMark LineColor="165, 172, 181" />
<MajorGrid LineColor="Transparent" />
<LabelStyle Font="{0}, 10.5px" ForeColor="59, 59, 59" />
</AxisX>
</ChartArea>
</ChartAreas>
<Titles>
<Title Alignment="TopLeft" DockingOffset="-3" Font="{0}, 13px" ForeColor="59, 59, 59"></Title>
</Titles>
<Legends>
<Legend Alignment="Center" LegendStyle="Table" Docking="right" IsEquallySpacedItems="True" LegendItemOrder="ReversedSeriesOrder" Font="{0}, 11px" ShadowColor="0, 0, 0, 0" ForeColor="59, 59, 59" />
</Legends>
</Chart>
</presentationdescription>
<isdefault>false</isdefault>
</visualization>


