web
You’re offline. This is a read only version of the page.
close
Skip to main content

Notifications

Announcements

No record found.

Community site session details

Community site session details

Session Id :
Microsoft Dynamics CRM (Archived)

Creating a bar chart with average sector spend overlay

(1) ShareShare
ReportReport
Posted on by

Hello everybody,

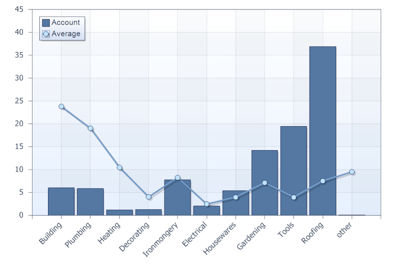
Would it be possible to create a bar chart to show the product spend for a customer with the average sector spend overlaid.  In effect, the bar chart would show the annual spend on product X, Y and Z. The average line would total the sector spend across the same categories, so that gaps can be identified.  Hopefully the graph would be interactive and we could drill down into each category to see the same graph, but for product families, and then further to see product variants.  

Graph.png

*This post is locked for comments

I have the same question (0)
  • Community Member Profile Picture
    on at

    Bump of the thread just to see if anybody might have an idea on this? The only thing I can imagine is just two separate graphs next to each other as I can't see a way to do an overlay like this.

    Thanks.

  • Suggested answer
    Siraj M Profile Picture
    on at

    check if this combo chart works for you

    Regards,

    Siraj

  • Community Member Profile Picture
    on at
    [deleted]
  • Verified answer
    Community Member Profile Picture
    on at

    Thanks. I found another way through one of my colleagues:

    Use Power Bi integrated with Dynamics. Create a line and clustered column chart graph and display it within the Dynamics CRM dashboard.

  • Community Member Profile Picture
    on at

    Mahesh,

    A community is for sharing info and answers rather than trying to sell your services. Maybe something you should consider going by some of your replies to questions.

Under review

Thank you for your reply! To ensure a great experience for everyone, your content is awaiting approval by our Community Managers. Please check back later.

Helpful resources

Quick Links

Responsible AI policies

As AI tools become more common, we’re introducing a Responsible AI Use…

Neeraj Kumar – Community Spotlight

We are honored to recognize Neeraj Kumar as our Community Spotlight honoree for…

Leaderboard > 🔒一 Microsoft Dynamics CRM (Archived)

#1
SA-08121319-0 Profile Picture

SA-08121319-0 4

#1
Calum MacFarlane Profile Picture

Calum MacFarlane 4

#3
Alex Fun Wei Jie Profile Picture

Alex Fun Wei Jie 2

Last 30 days Overall leaderboard

Featured topics

Product updates

Dynamics 365 release plans