Hi
We have a customer who is running AX 2009 and currently the customer complains about sporadic system hangs. My first level of debugging was to activate "Long queries" SQL trace for some specific users. I would certainly expect to see any poor performing queries in the SQL trace, however to my surprise this was not the case. I was able to reproduce the system hang. The issue is not consistent. The hang would occur once every 20 or 30 times I opened the same form with the same queries. The system hangs up to 2 minutes. Even though the system hangs for up to 2 minutes the longest query in my SQL trace was 4 seconds.
My next level of debugging is the Trace Parser. In the Trace Parser i am a bit puzzled about the this specific value:
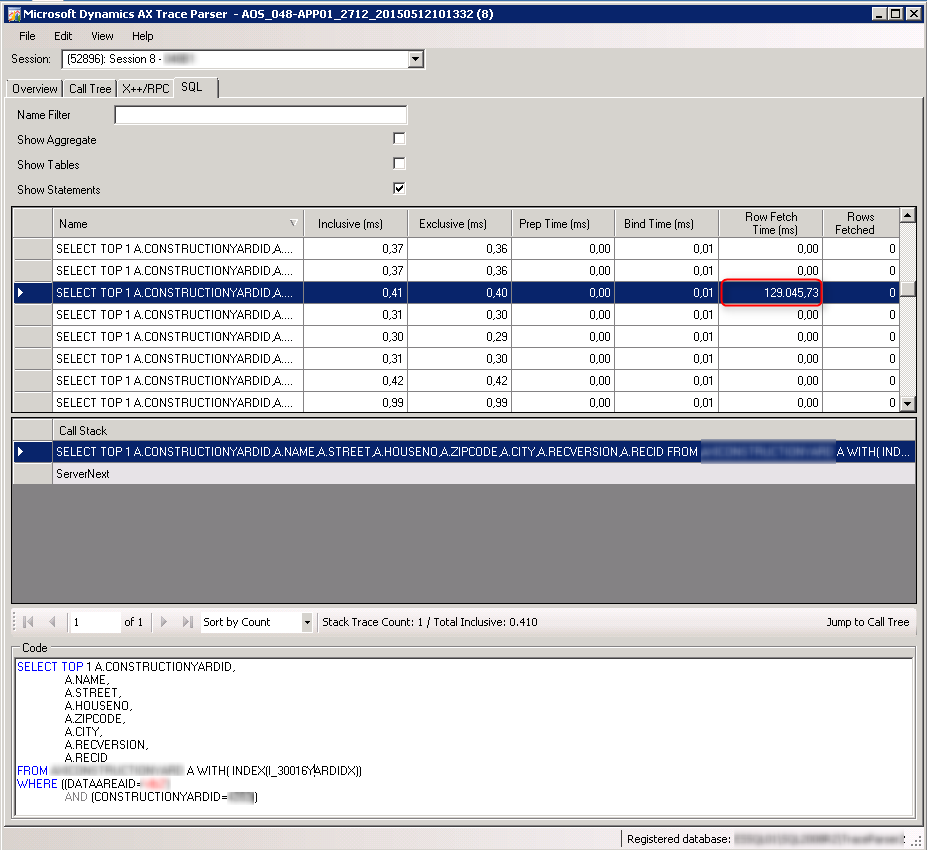
(Please note that the screen shot does not show aggregated values)
This is not the statement showing in the "Long queries" SQL trace, and looking at the "Inclusive (ms)" and "Exclusive (ms)" columns everything looks fine. However looking at the "Row Fetch Time (ms)" column I see a value which could explain a 2 minute system hang. The specific query is executed many times, and most of them show '0.00' in the "Row Fetch Time (ms)" column.
Generally looking at the "Inclusive (ms)" column, also in the "Call Tree" and "X++/RPC" tabs, nothing else seems to be able to explain the system hangs.
Now to the questions:
1) Does anybody knows what operations are covered in the "Row Fetch Time (ms)" value?
2) What should I look for on the SQL server?
3) Has anybody experienced similar behavior.
Thanks,
Jesper


