Hi Everyone,
I am currently using Power BI to visualize invoiced sales passing through Business Central and I am currently struggling on how to shape my sales fact table (Posted Sales Invoice) and data model in order to show display sales in 2 ways (see below).
What I want to achieve:
I would like to show the sales (coming from the "Posted Sales Invoice" table) per item (items present in the "Item" table) from Business Central in Power BI and include the displays (drill down of items present in each display in the "Assembly BOM" table) in two different ways, 1. visualization showing the sales of all items incl. displays as one single item (= showing the sales from the Posted Sales Invoice table) and 2. visualization showing the sales of all items incl. displays but exploded on the item composing the display (= showing the sales from the Posted Sales Invoice table but displays revenue & quantity are allocated to the items composing the display, use of Assembly BOM for this). Below more in depth information on the source tables & each visualization I would like to create (
link to google sheet):
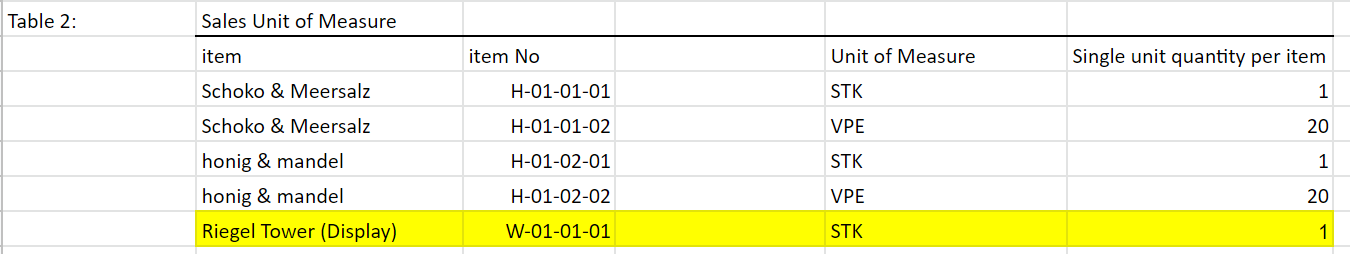
Source Tables (all coming from Business Central): yellow highlighted lines are showing display items
- Posted Sales Invoice: Sales data (quantity sold & revenue per invoice, customer, items - displays are sold as a normal item)
- Sales Unit of Measure: Table used to calculate the quantity per single units using the Single unit quantity per item & matching with Posted Sales Invoice table using the item No & the Unit of Measure
- Assembly BOM: Table used to retrieve the information on which items the display is composed of and how many of them are included
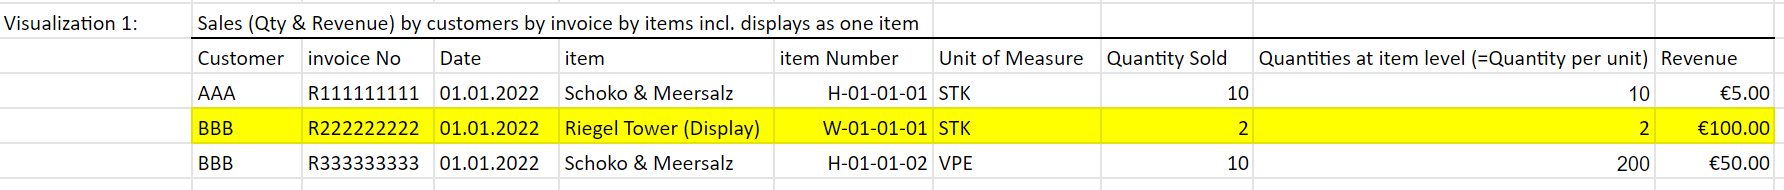
1. Visualization 1:
- Description: Showing the amount sold (qty & revenue) per items (displays incl. and shown as one single item) per customers, invoices & date = Posted Sales Invoice table
- Use Case:
- Forecasting sales of displays and forecasting sales of non-display items (= product)
- Understanding how much displays have been sold to a specific customer & compare it to last year
- Filter sales on display item
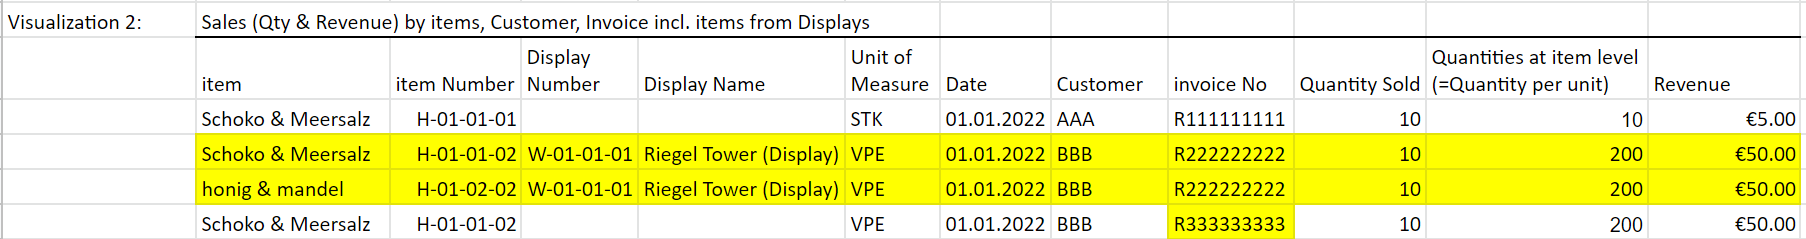
Visualization 2:
- Description: Showing the amount sold (qty & revenue) per items (displays incl. but exploded on the items composing the display) per customers, invoices & date
- Use Case:
- Doing item specific analysis (calculating the amount of product sold directly and through the display
- Understanding the weight displays have in the sales of a specific product
- Understanding the total amount sold (qty & revenue) per product
Best,
Kevin


