Author Note
All content, including samples, images and writings can be found in my GitHub repo.
This specific article appears here.
Revisions
02/13/2023 - Fixed images, updated titles. Renamed Common Data Service to Dataverse
2022 Bootcamp Session
Summary
is a service allowing makers to create business processes, orchestrations and workflows to help achieve common and even complex business requirements. Within the Power Platform, Power Automate represents one of the most important pillars of the platform. It provides a no to low code solution to process automation. From sending , to complex flows, Power Automate can be used in virtually any workload.
If you have not already reviewed Part 1 in the Power Automate Run Time series, please do so as this article is a continuation of previous installments. In this article we will discuss Tracked Properties and how they can be used across actions with a Microsoft Power Automate Flow. We will then look into handling and capturing error information within actions to help troubleshoot and report on failing actions or flows. Finally we will examine the Try, Catch, Finally pattern and result function for monitoring insights.
Action Tracked Properties
Tracked Properties are part of most actions within Power Automate. With tracked properties, we can set variables such as time stamps, capture trigger headers and outputs, action outputs, or even previous tracked properties from earlier actions. Expressions, such as "utcNow, outputs, actions" can be used to track what normally wouldn't be stored in action inputs.
Action Headers Example
Consider the image below which shows capturing the status code and API throttle information for a List Records action in the Dataverse (current environment) connector.
NOTE: CLICK ON AN IMAGE TO ENLARGE TO SHOW DETAIL
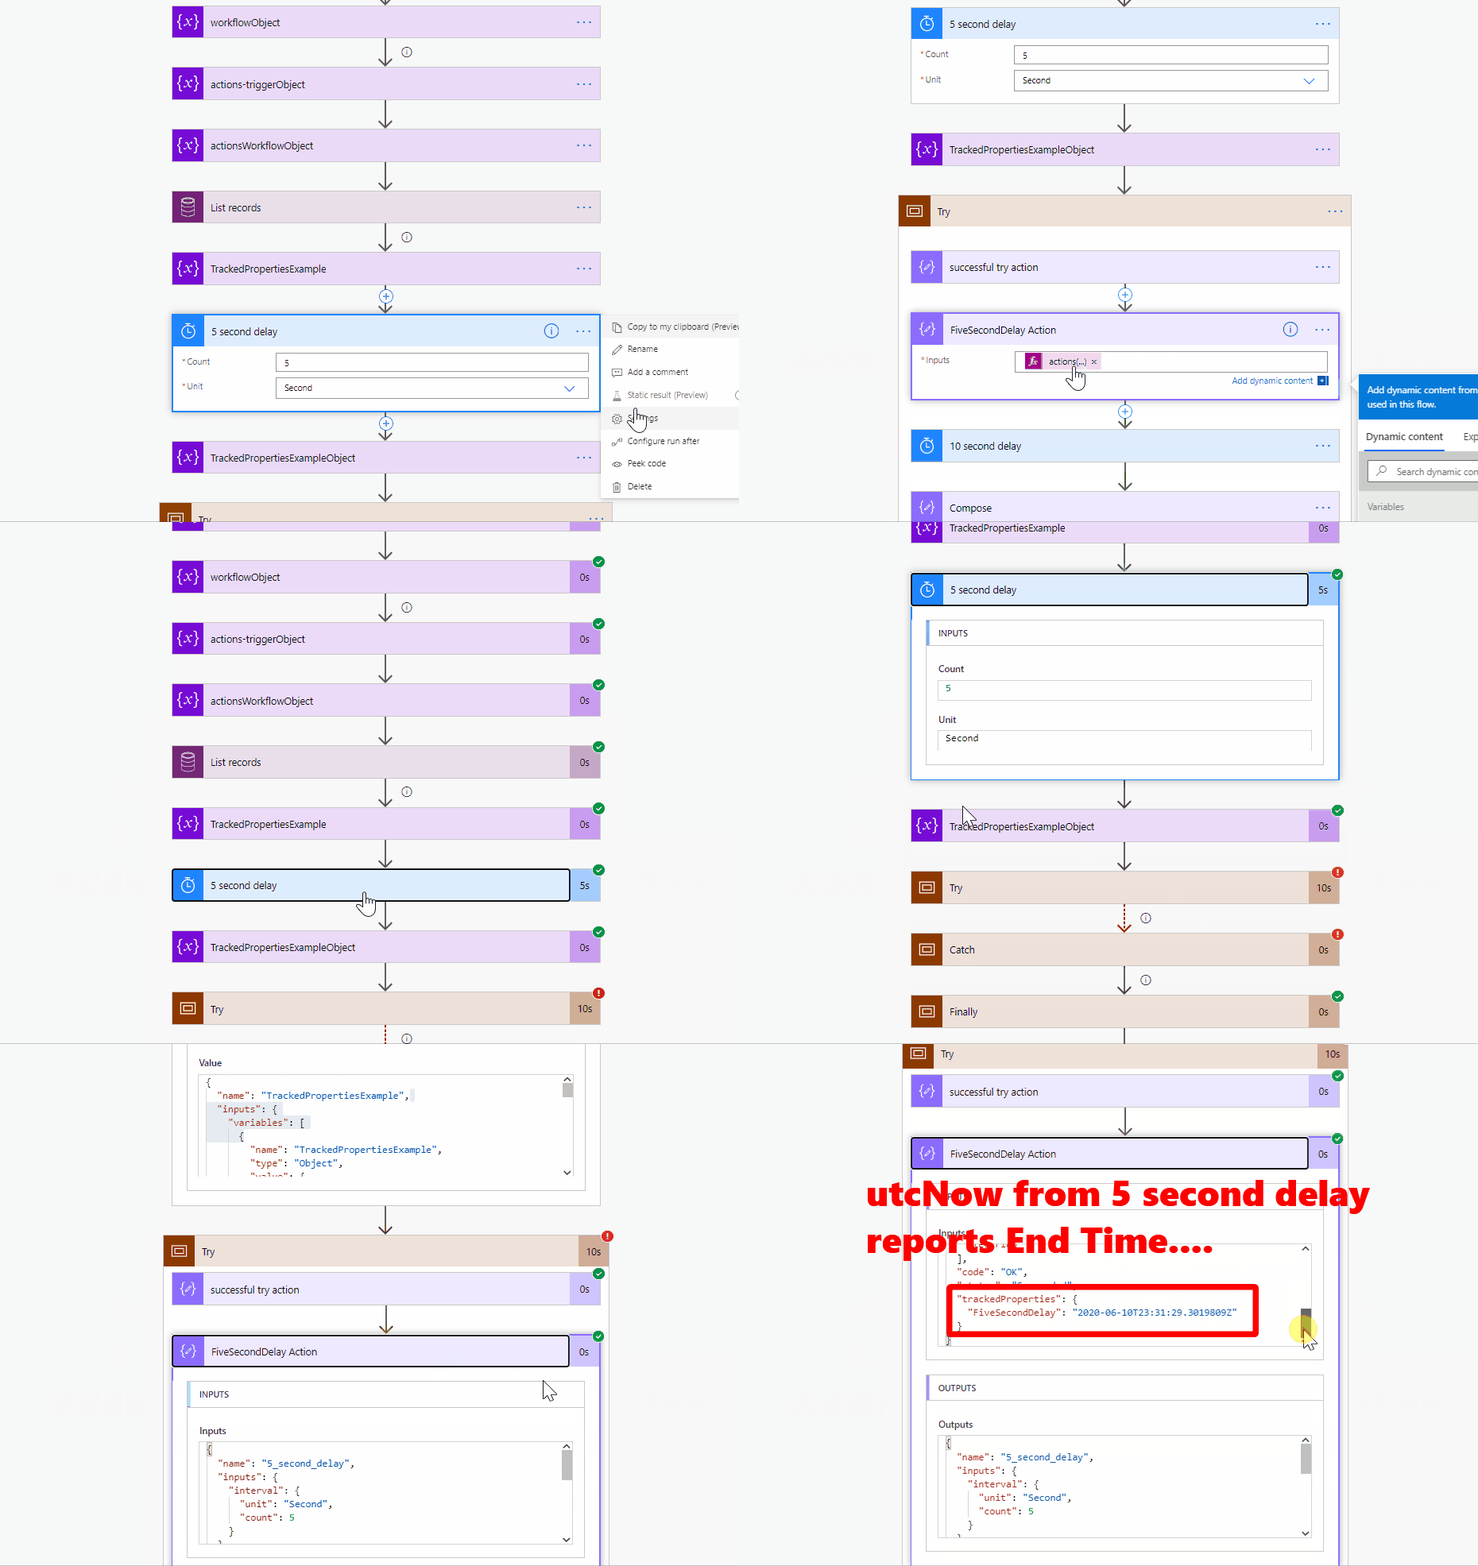
The example image below, where we are performing a 'List records' with the Dataverse connector, now has a more friendly way of tracking the response code and API throttling response. This is a light weight example but should drive home the concept of how, using Tracked Properties, I can now reference the "TrackedPropertiesExample" variable which now includes outputs from a previous action.
NOTE: A key point here is that the action function will work for tracking current action data but not previous actions with the actions function. Attempting to do so will result in the "Tracked properties can only reference its own action's inputs and outputs, trigger inputs and outputs and parameters." error.
Timestamp Example
Using "utcNow()" as a tracked property for an action creates an interesting result. At first impression, we would be led to believe this may represent the start time of an action. However, when reviewing the output this function actually produces the end time exactly as if we were to reference it from the output of the action. Consider the below gif:

You can see that the five second delay is showing the tracked property "FiveSecondDelay" as the same timestamp as the endTime from the output!
Finally, as we look to Azure Logic Apps and what may come with Microsoft Power Automate, we can see how tracked properties work with monitoring solutions. Azure Logic Apps can to log logic app runs. One way to extend the information stored in the log store is to .

Handling and Capturing Errors in Actions
Typically Microsoft Power Automate flows will fail out if an issue occurs. Manually we can review these failures in the Power Automate Portal or with PowerShell. However inside the Power Automate flow we have the ability to track the statusCode within the actions function. Along with the Configure Run After setting we can conditionally capture any error messages and report or store for analysis.
Configure Run After
The Configure Run After setting allows the flow to continue if an error or timeout occurs. This can be used in conjunction with the below image showing a conditional based on status code of a previous HTTP request output body:
does a great job detailing the "run after" behavior. Each action is marked with a status of "Succeeded", "Failed", "Skipped" or "TimedOut". The below image, from the Azure Logic App documentation, details how the "run after" behavior works in parallel branches.

Retry Policies
Retry architectural patterns are nothing new in our continually evolving, interconnected world of dispersed systems. In , he goes into great detail discussing various patterns. One such example to handle errors when connecting and processing integration requests and responses involving retry is the . (pgs 206 - 212).
In the case of Microsoft Power Automate and Azure Logic Apps, we have a feature called which can be beneficial when working with integrations. Based on the status code returned (408, 429, 5xx, ect), the retry action can be configured to trigger a retry based on different intervals (Default, Exponential, Fixed).
Mock Responses
which can be helpful to troubleshoot without invoking a live system or for designing error handling.
These simulated responses can be used, similar to mocks, when developing custom APIs and are quite useful when building custom connectors. The response can be successful, error prone, time out prone, etc based on the scenario. A specific status code and response can be added to help troubleshoot these specific scenarios.
The image below shows setting up a failed mock response and the many different error codes.
NOTE: Depending on what connector you're using, you may not be able to use certain error codes.
The below image shows mocking a Dataverse error response:
This image shows mocking a Dataverse error response:
Finally, the below image shows the run history and capturing the error response from the Dataverse:
Throttling with Azure Logic Apps
Throttling in Azure Logic Apps has many facets and can stem from all sorts of potential areas. Connectors can be throttled, destination APIs can be throttled and depending if you're running in an integration service environment (ISE) or not can impact that. when deciding an implementation approach with Azure Logic Apps. Scenarios such as dealing with Azure Service Bus queues are thoroughly examined (e.g. using nested logic apps...this technique will work for Microsoft Power Automate as well!)
Webhook Tester Site and runtime debugging
The below reference and steps are taken from the . This technique of using the Webhook Tester site for debugging run time integrations is very useful. An added benefit is that the Webhook Tester site allows for both cloud and local based (e.g. Docker containers, Virtual Machines, etc).
To help with debugging, you can add diagnostic steps to a logic app workflow, along with reviewing the trigger and runs history. For example, you can add steps that use the service so that you can inspect HTTP requests and determine their exact size, shape, and format.
-
Go to the site and copy the generated unique URL.
-
In your logic app, add an HTTP POST action plus the body content that you want to test, for example, an expression or another step output.
-
Paste your URL from Webhook Tester into the HTTP POST action.
-
To review how a request is formed when generated from the Logic Apps engine, run the logic app, and revisit the Webhook Tester site for more details.
For more information,
NOTE: This tool is useful for testing outside of Power Automate including any resource that has HTTP Post capabilities, examples including Azure Functions and GitHub Web hooks!
Scopes and the Try, Catch, Finally Pattern
, actions can be in a logical group allowing for evaluation of multiple actions as a whole. This comes into play when working with exception and error handling. Scopes provide statuses similar to Power Automate flows or Logic Apps themselves such as "Succeeded", "Failed", "Cancelled", etc. Pieter Veenstra has a really nice approach, "" for using scopes to implement a Try, Catch, Finally pattern which i'll discuss below.
In the image below are three scope objects titled "Try", "Catch" and "Finally".
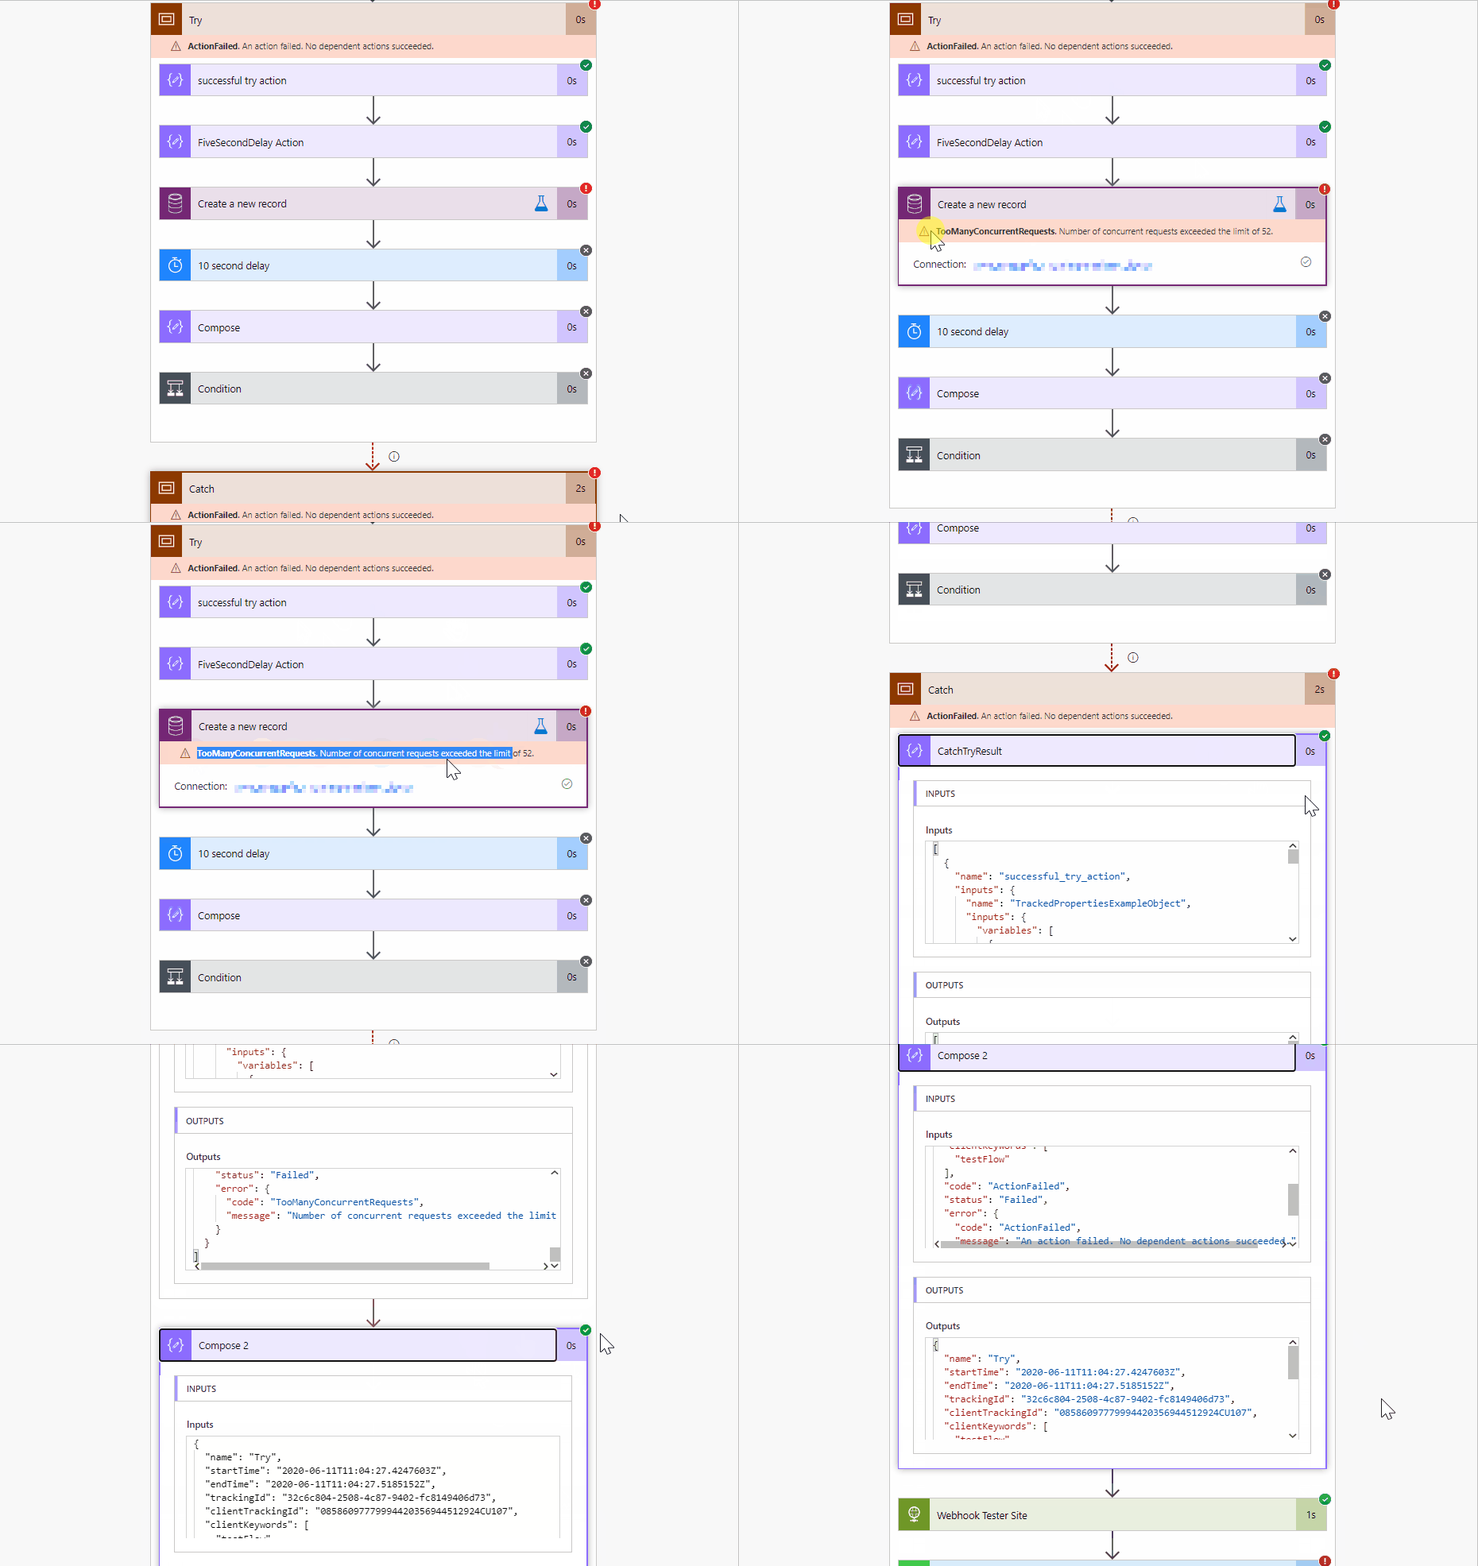
From a recent flow run, expanding the Try block, we can see two successful actions followed by our mocked failed response from the Dataverse:
The Catch scope underneath the Try scope is using the run after property of the Try scope to catch results with a status of "Failed". If any actions inside the Try scope, at least how this example is configured, fails, the Catch scope will begin processing. The remaining actions within the Try scope are not processed.
Below is an image of the Catch scope with Tracked Properties:
To work with the Try scope within the Catch scope, we will use the results function which provides context to what happened within the Try scope.
Result Function
The function, as shown in the reference link, returns an array object. At first glance this seems fairly straight forward until we dig deeper into the . The actions returned with the results function such as start and end time and tracking identifiers. You'll also see that they include properties indicating if they were successful or not.
The image below shows a successful action named "successful_try_action" and a failed action named "Condition". Each action includes two properties, code and message that can be used . The successful action is in green while the failed action is in red.
Finally, the below gif shows working with the Try, Catch, Finally pattern and scope and results objects to capture and report. This technique can be continued to then send data to Azure Application Insights or Azure Log Analytics as briefly shown below. I'll cover this in an upcoming article!

Next Steps
In this article we have discussed tracking properties across actions to help supplement reporting. When examining error handling and preparing for designing resilient Microsoft Power Automate flows we examined various patterns. Utilizing retry policies, configuring the run after conditions and implementing scope can all help build an enterprise ready flow.
In previous articles, . In the following articles covering Microsoft Power Automate Flow run time, we will discuss pushing events to Application Insights and reviewing previous flow runs for monitoring and governance.
If you are interested in learning more about , which includes a , please contact your Microsoft representative for further details.
Your feedback is extremely valuable.
Index


 Like
Like Report
*This post is locked for comments