


 Like
Like Share
Share
 Report
Introduction:
This blog explains how to embed D365 Field Service Charts in D365 Online Portals.
Steps of Implementation:
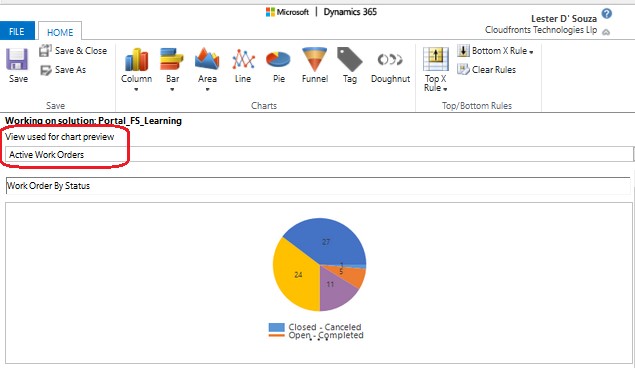
1. Get Guid of Chart and View used for Chart in D365 Field Service.
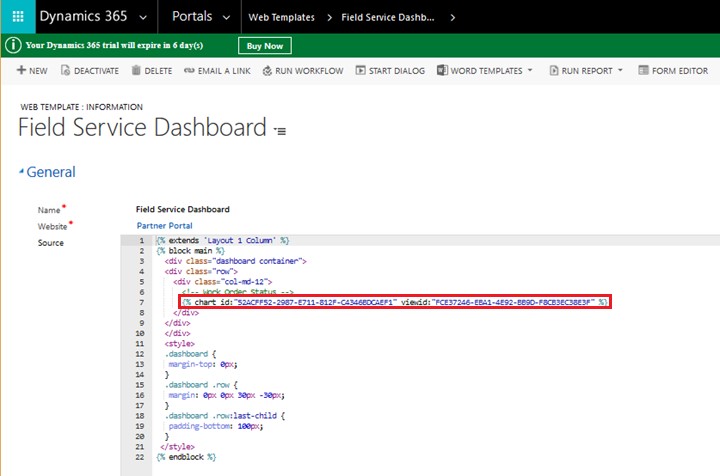
2. Create a new Web Template, Portals -> Web Templates and write code in Source field with Chart ID and View ID as copied in Step 1 as below.
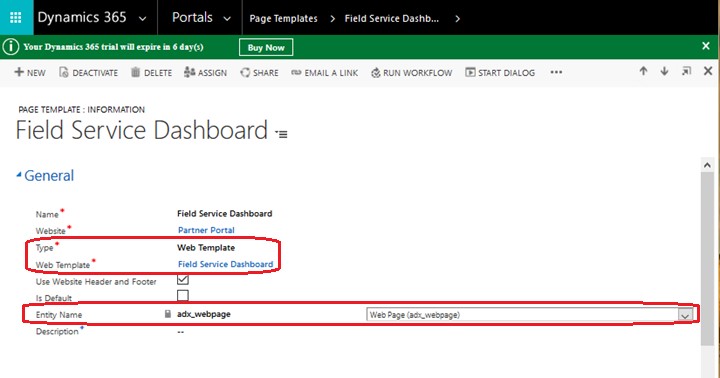
3. Create a new Page Template, Portals -> Page Templates and set details as highlighted below.
4. Create a new Web Page in D365 Online Portals and set Page Template created in Step 3.
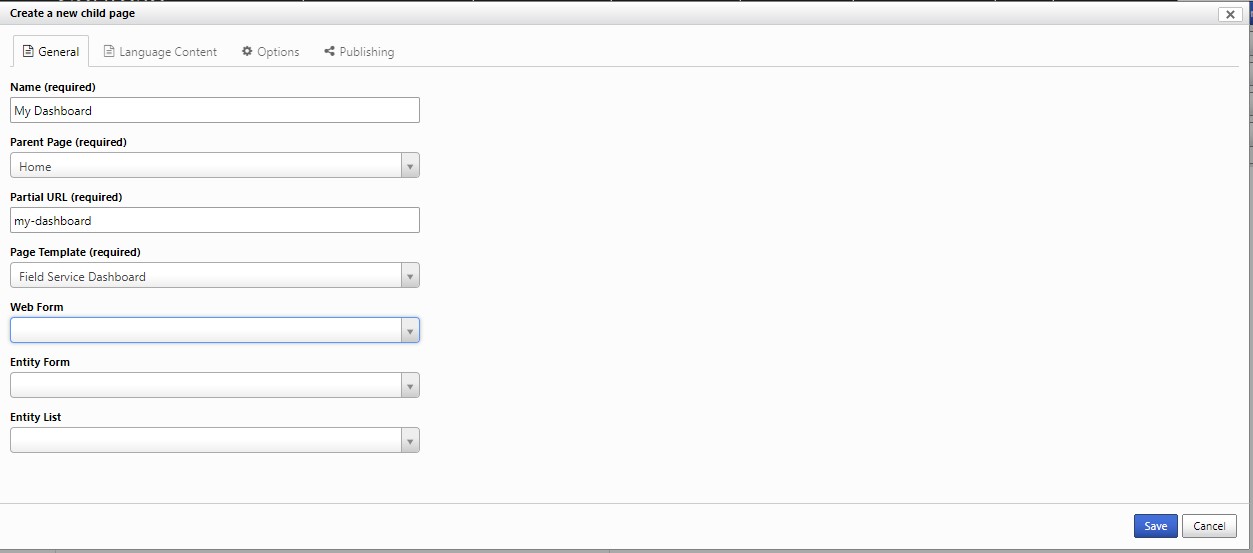
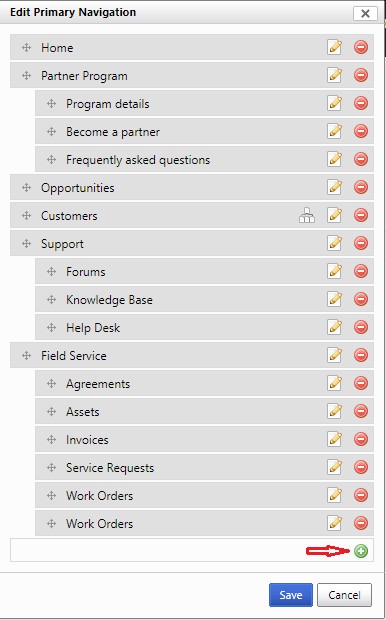
5. Create a new Link for Dashboard in D365 Online Portals.
- Hover Mouse on Home button and click on Edit option.

- Click on New button as highlighted below.
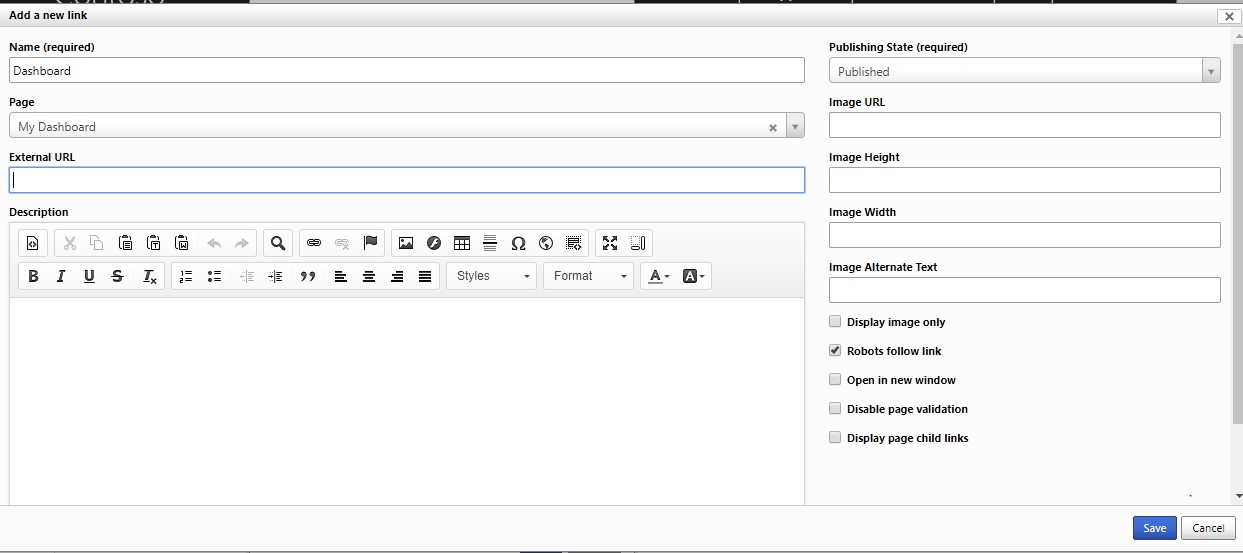
- Enter details as shown below and click on Save button.
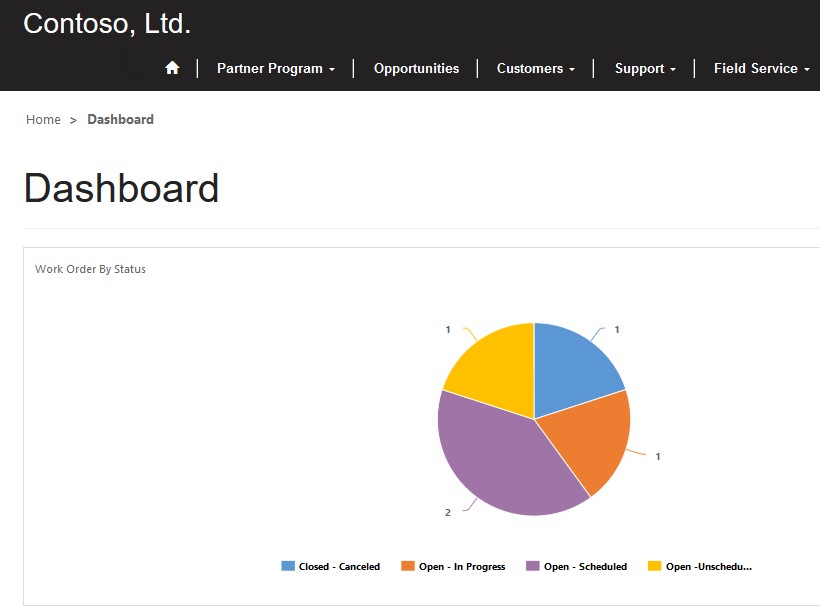
Conclusion:
Above description in blog helps users to create Dashboard in D365 Online Portals by embedding D365 Field Service Charts as below.
The post Embedding D365 Field Service Charts in D365 Online Portals appeared first on CloudFronts - Microsoft Dynamics 365 | Power BI | Azure.
*This post is locked for comments