Qlik Sense: Personalized straight tables with chart exploration
Qlik has further expanded the visualization capabilities for Qlik Sense. The Visualization Bundle now includes a new customizable straight table with chart exploration.
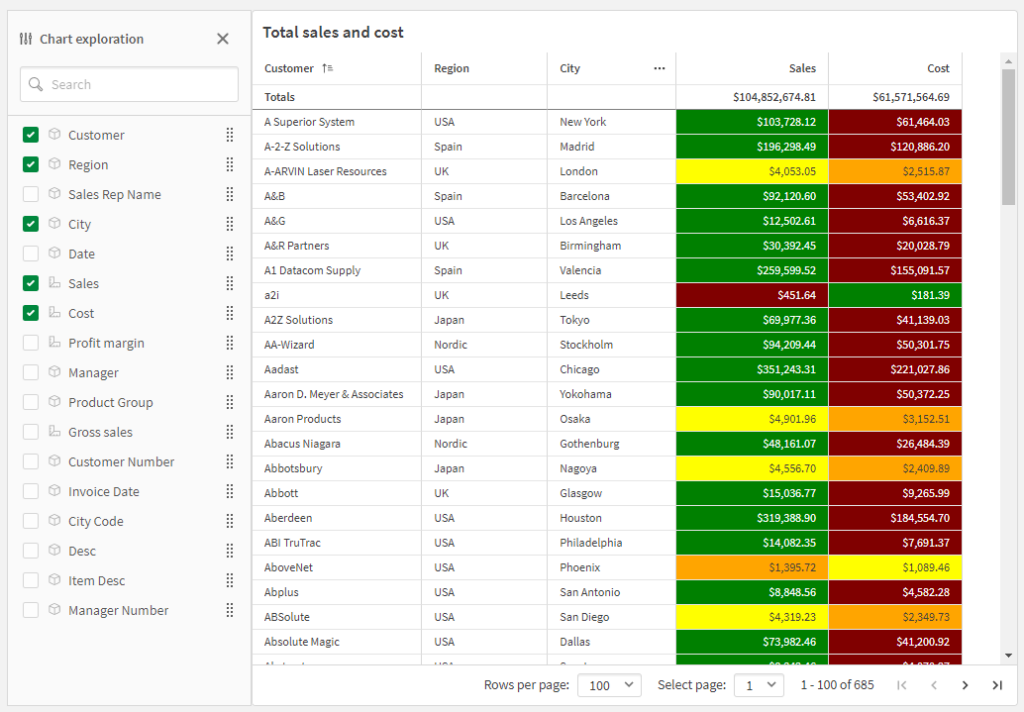
The Visualization Bundle recently added the new straight table, which is available through the advanced options. It serves as a catch-all table and greatly enhances the self-service capabilities with chart exploration. App users can use it to flexibly determine how their table should be presented.
The straight table shows several fields at once, with the contents of each row logically connected. A table can consist of any number of dimensions and key measures. App creators can add multiple fields at once, customize the table at the column level, add alternate dimensions and measures, set the column width, apply pagination, and enable chart exploration.
Using chart exploration, users can then customize the original straight table while in analysis mode, even without edit rights. They can add, re-arrange, or remove columns, change the sort order, and make selections. Finally, the new table layout can be shared, downloaded, subscribed to, or bookmarked.
The changes made in chart exploration mode are not visible to other users working with the same sheet. This is especially useful in apps that are viewed by many different people with different needs.

Table with numerous advantages
A straight table chart can be used, for example, when detailed data and accurate values are to be displayed instead of visualizations. Tables are particularly useful for comparing individual values. Drill-down group dimensions are very effective in tables.
In addition, tables can filter and sort in different ways. A table can contain many values, making it ideal for displaying exact values rather than trends and patterns. Drilling down into a table is also an ideal way to make use of the limited space available on the sheet. Tables are also an easy way to export data to other programs.
The post Qlik Sense: Personalized straight tables with chart exploration appeared first on ERP & BI Newsroom.
This was originally posted here.


 Report
*This post is locked for comments