Streaming Data Sets into Dynamics 365 Customer Engagement
Views (655)
 Kyle Hill
In this post, we are going to look at the challenge of how to display streaming data sets directly onto a Dynamics 365 Customer Engagement form. While there already exists a way to embed Power BI dashboards and reports within Dynamics 365 Customer Engagement, these are not on a form level. To see how to do this currently, have a look here. When followed, you should observe results similar to the following, where a dashboard is initially displayed and then you can click though to the underlying report(s):
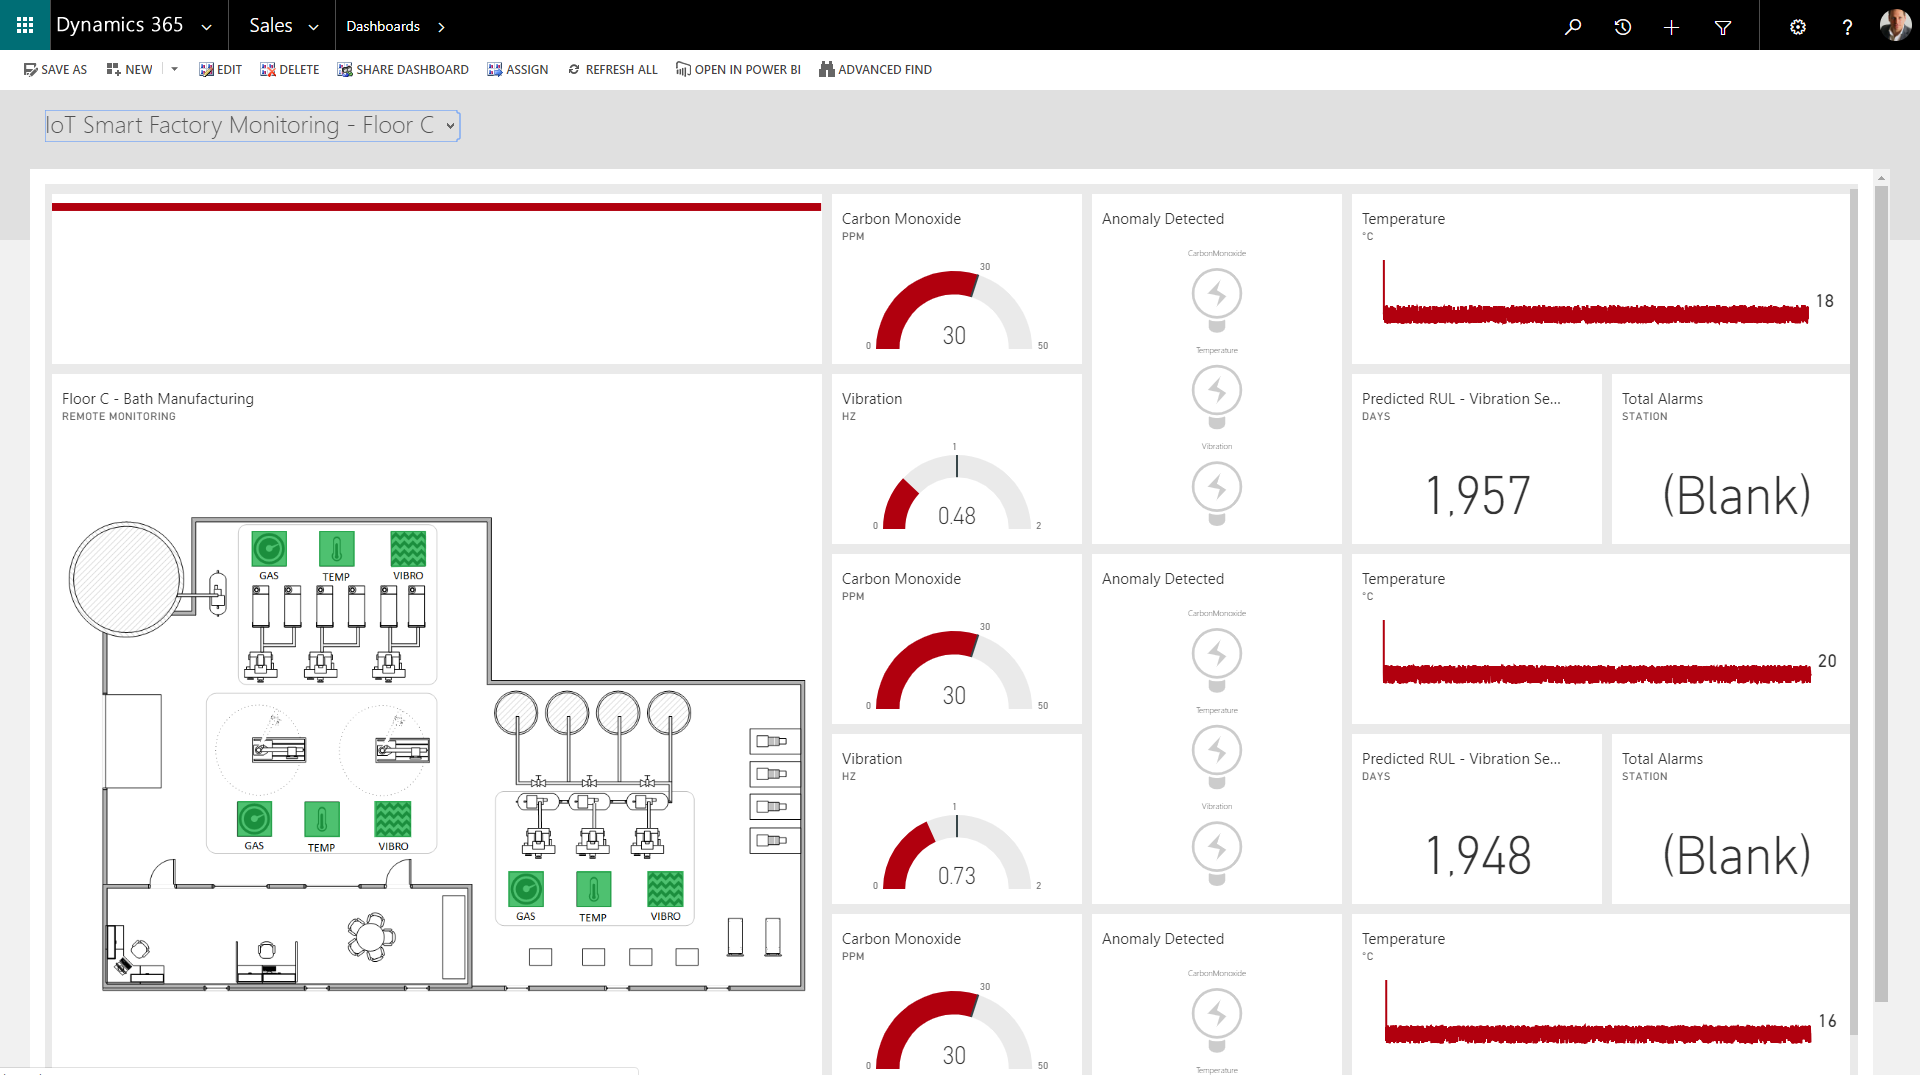
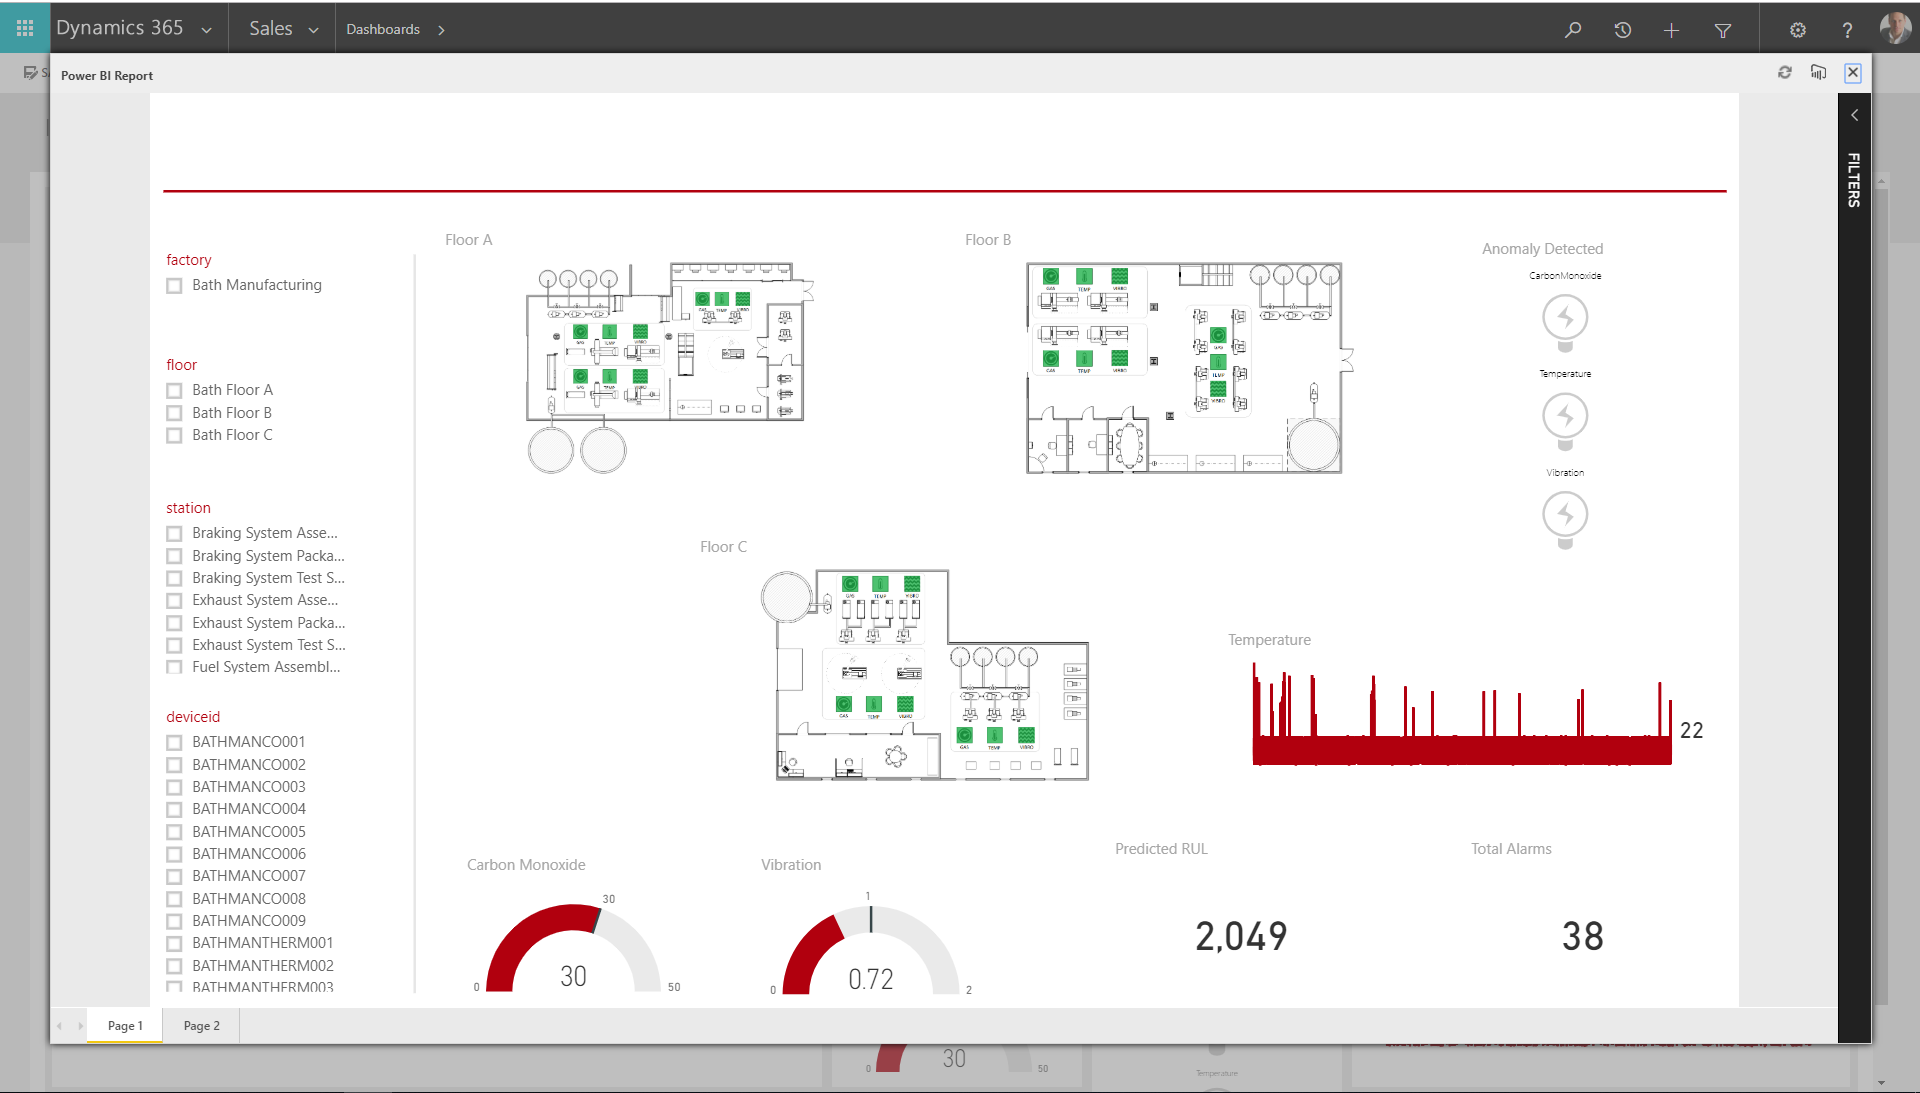
What you'll notice from this is that these are personal dashboards that lack the ability to be contextually filtered. So to resolve this, we are going to create a Web Resource that has the ability to display a contextual (and streaming) dashboard on a Dynamics 365 Customer Engagement form!
To get started, lets have a look at what this will look like architecturally:
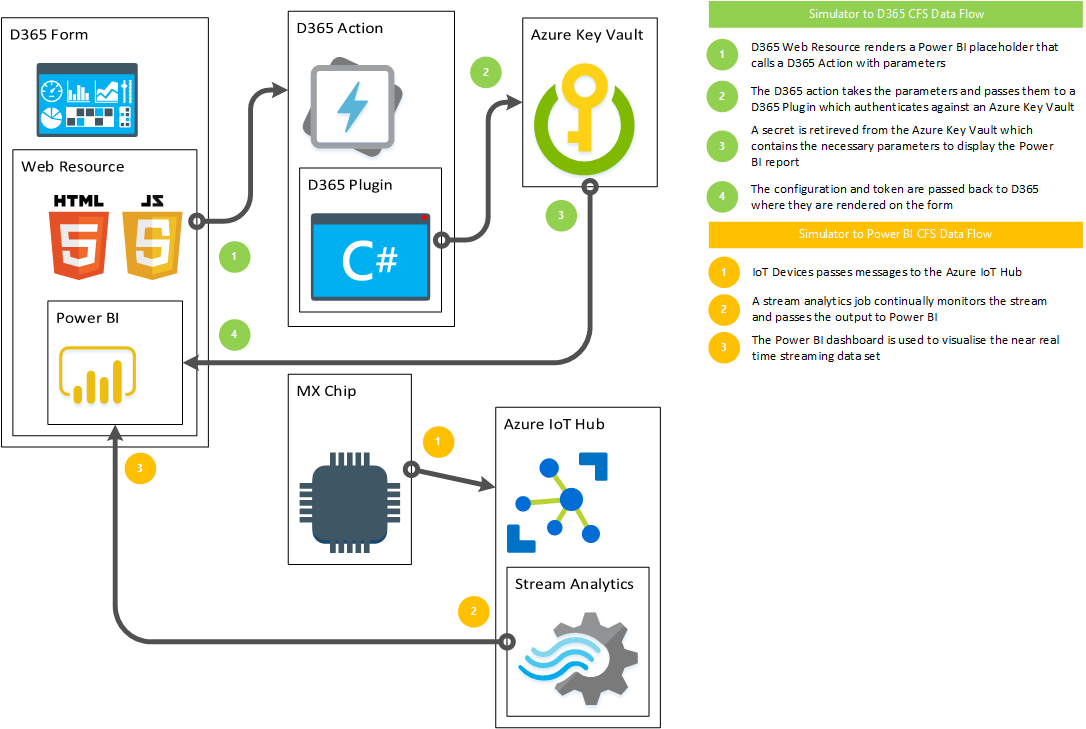
From the architecture, you should notice that we need to create a custom HTML Web Resource that will serve as a placeholder for the Power BI dashboard. When the form loads, we are going to use JavaScript to process the incoming parameters which can include both configurations and contextual data based on the record (form) that the Web Resource is being rendered on. The JavaScript will then call a reusable Dynamics 365 Action that will consume the incoming parameters before calling a Dynamics 365 Plugin. This plugin is necessary as it will help us execute a token exchange with the Azure Key Vault based on the currently logged in user. This token is then used in retrieving a specific secret which contains the required configurations necessary to render the Power BI report contextually and in an authenticated state back on the Dynamics 365 Customer Engagement form.
Simultaneously, the Power BI dashboard will be receiving a continuous stream of data from an MX Chip (IoT Device) that is connected to an Azure IoT Hub. This stream of data is provided through the Stream Analytics service which continually processes the incoming data and is able to send it as an output direct to Power BI before it is visualised. For reference, the Stream Analytics Job should look something similar to this:
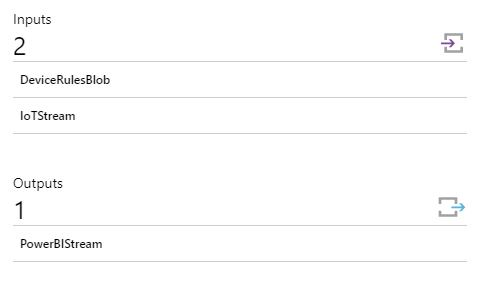
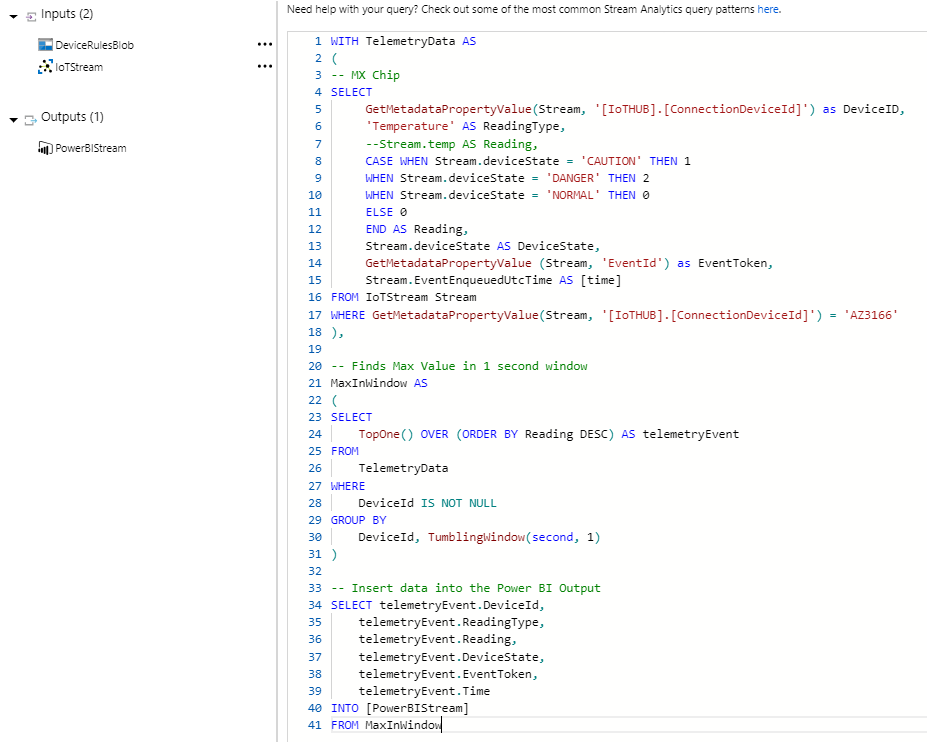
You will notice that there is a dedicated Power BI output in the above and that we have limited the Stream Analytics job just to look for our MX Chip device. We also need to include a bit of DAXto format the incoming IoTAlert data to be a bit more readable. Examples of the incoming data, the DAX, and the Power BI configs are below:
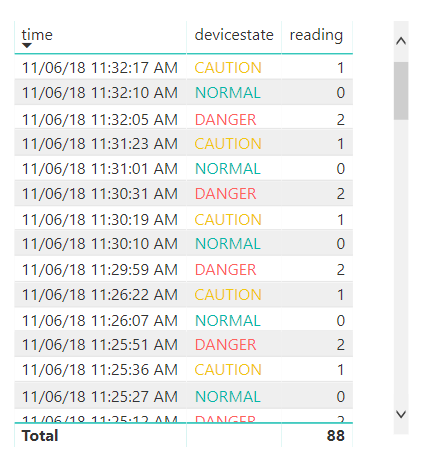

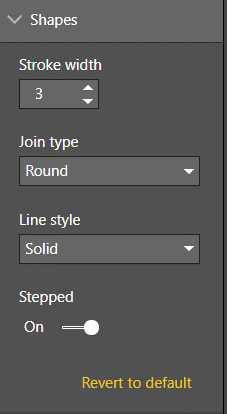
As a result of this, we should now be able to see the streaming data set on the Dynamics 365 Customer Engagement form after a bit of Power BI visualisation magic as follows:
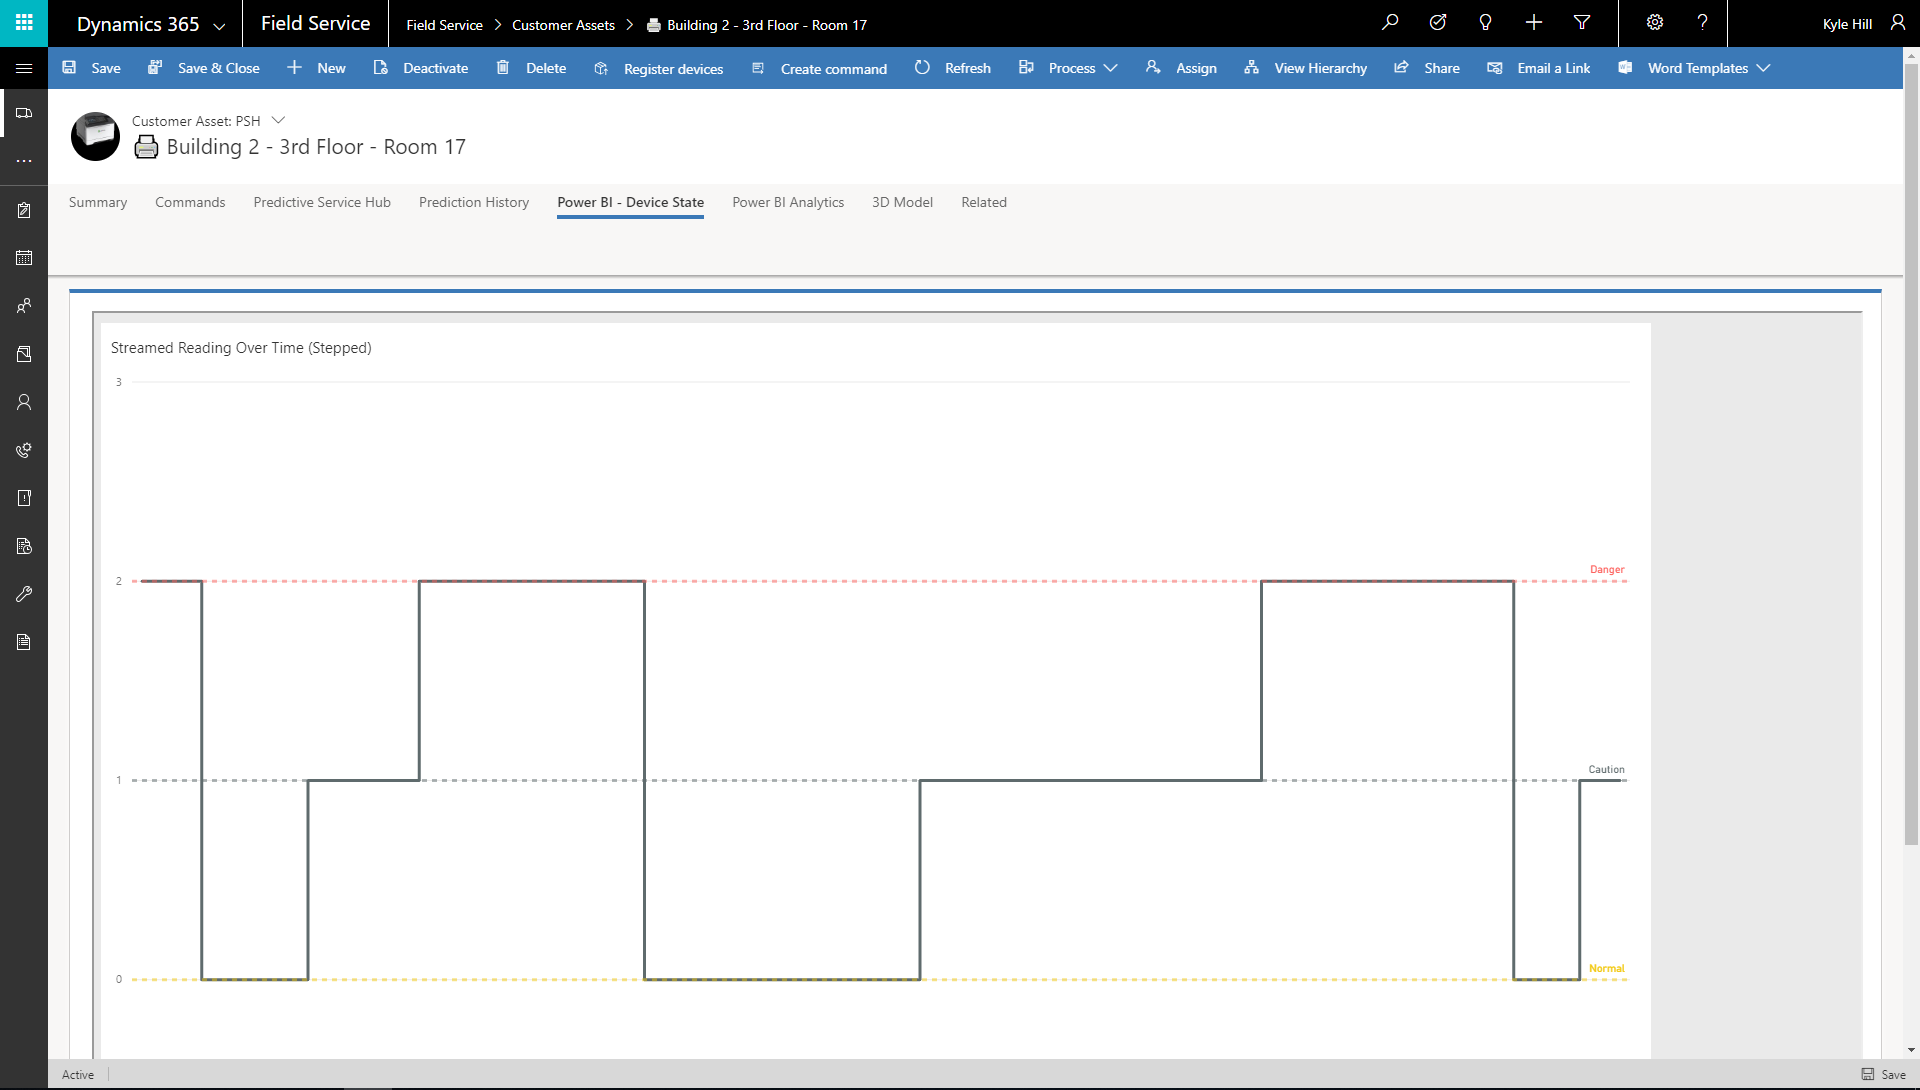
As we have parameterised the initial Web Resource on the form, this Dashboard is able to pre-filter visuals should we wish, and can also easily be embedded on the form and record type of your choosing! The following video demonstrates the complete pattern in action:


 Like
Like Report
*This post is locked for comments