web
You’re offline. This is a read only version of the page.
close
Skip to main content

Announcements

No record found.

News and Announcements icon
Community site session details

Community site session details

Session Id :
Microsoft Dynamics AX (Archived)

Call stack is not tracing calling method in D365

(0) ShareShare
ReportReport
Posted on by 1,093

Hi Expert,

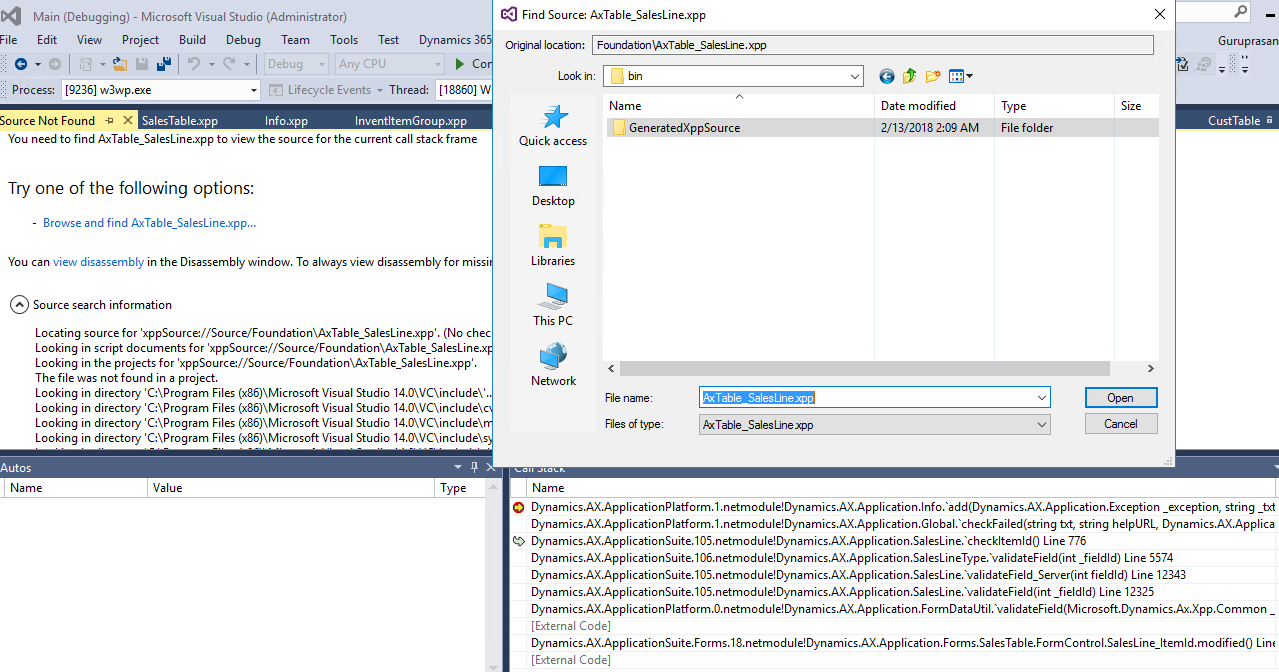
When I trace the calling method in call stack every time its asking for me add .xpp file (source not found) as shown in the image. but if I directly put the breakpoint its opening, can anyone tell me what's the reason for this.

(in below screen: lets say when I double click on the sales line )

debugger.PNG

Thanks in Advance 

Guru

*This post is locked for comments

I have the same question (0)
  • Sukrut Parab Profile Picture
    71,735 Moderator on at

    Did you check if "Load symbols for elements belongs to Solution" check box is unchecked  in debugging options

  • Suggested answer
    Martin Dráb Profile Picture
    239,140 Most Valuable Professional on at

    Open a Visual Studio solution (it doesn't matter which one) and try it again.

  • Guruprasanna Profile Picture
    1,093 on at

    Thanks for your response,

    Hi Sukrut,

    Load symbols only for the items in the solution is unchecked.

    Hi Martin,

    I tried by closing VS and reopened,  is this are u suggested? can you please describe more ..

    Thank you

    Guru

  • Guruprasanna Profile Picture
    1,093 on at

    And as i said if i consider sales Line as example the xpp file for sales line is under C:\AOSService\PackagesLocalDirectory\Bin\XppSource\Foundation\AxTable_SalesLine.xpp, if I manually select this file then debugger will go to the "salesLine" object. my question is why its not detecting respective xpp file automatically, and I have done the full build, am i missing any set up ?

    Thanks for help

    Guru

  • Verified answer
    Guruprasanna Profile Picture
    1,093 on at

    I referred this blog

    https://masudprogrammer.wordpress.com/2017/06/21/visual-studio-c-debugging-is-not-working/ and I opened the module window (Debug > windows >Modules) selected all and click on load symbols. After this whenever I double click on the stack trace that particular object is automatically added to the respective folder under the "C:\AOSService\PackagesLocalDirectory\Bin\XppSource\" path.

    Thank you

  • Martin Dráb Profile Picture
    239,140 Most Valuable Professional on at

    No, I meant opening a Visual Studio solution, not restarting Visual Studio.

    For example, open the last VS project (which is contained in a VS solution) that you worked with last time.

  • Community Member Profile Picture
    on at

    That fixed the problem. Many thanks!

Under review

Thank you for your reply! To ensure a great experience for everyone, your content is awaiting approval by our Community Managers. Please check back later.

Helpful resources

Quick Links

Introducing the 2026 Season 1 community Super Users

Congratulations to our 2026 Super Stars!

Meet the Microsoft Dynamics 365 Contact Center Champions

We are thrilled to have these Champions in our Community!

Congratulations to the March Top 10 Community Leaders

These are the community rock stars!

Leaderboard > 🔒一 Microsoft Dynamics AX (Archived)

#1
CP04-islander Profile Picture

CP04-islander 16

#2
GiacomoRovai Profile Picture

GiacomoRovai 4

#3
Douglas Noel Profile Picture

Douglas Noel 2

Last 30 days Overall leaderboard

Featured topics

Product updates

Dynamics 365 release plans