Hi Partner,
Here's a brief description on Visual filter and Global filter
Visual Filter
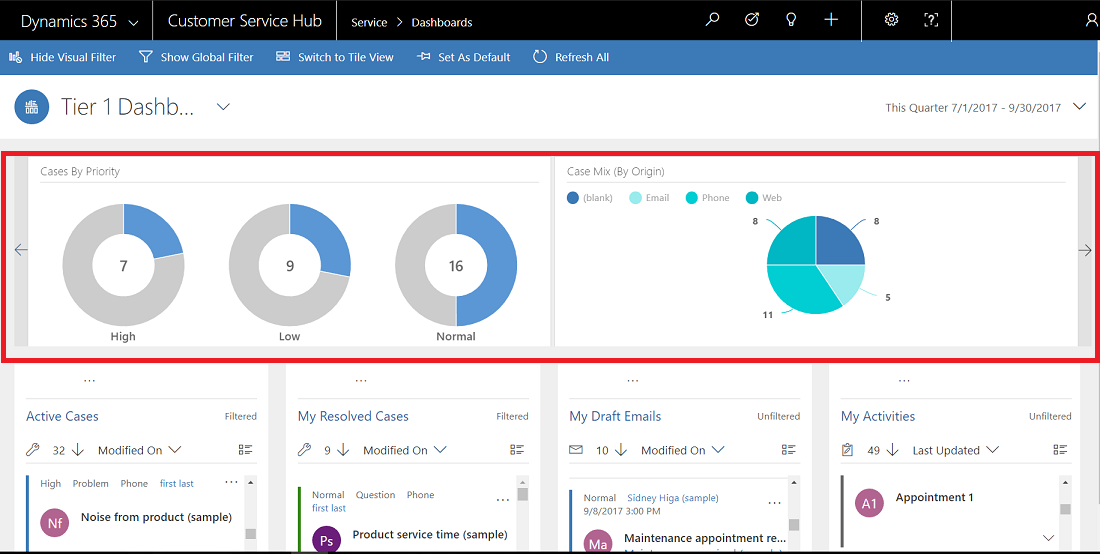
Visual filters provide a visual snapshot of key metrics, such as cases by priority or by origin. They also help removing clutter from the screen and display information that interests you most. For example, if you select the High Priority circle in the Cases by Priority chart, the dashboard will refresh and you’ll see only high priority cases in your data streams. You can find different types of charts on your dashboard, such as pie, bar, doughnut, or tag chart. Visual filters and tiles help you see the changes and patterns in data, and act quickly to address the most important issues.
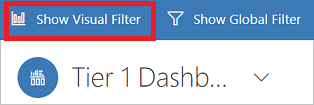
To display the charts on the dashboard, select the visual filter button in the dashboard header, as shown below. The clickable button acts as a toggle switch, to show or hide the visual filters on the dashboard. On the single-stream dashboard, the visual filters are always shown and can’t be hidden from the view.
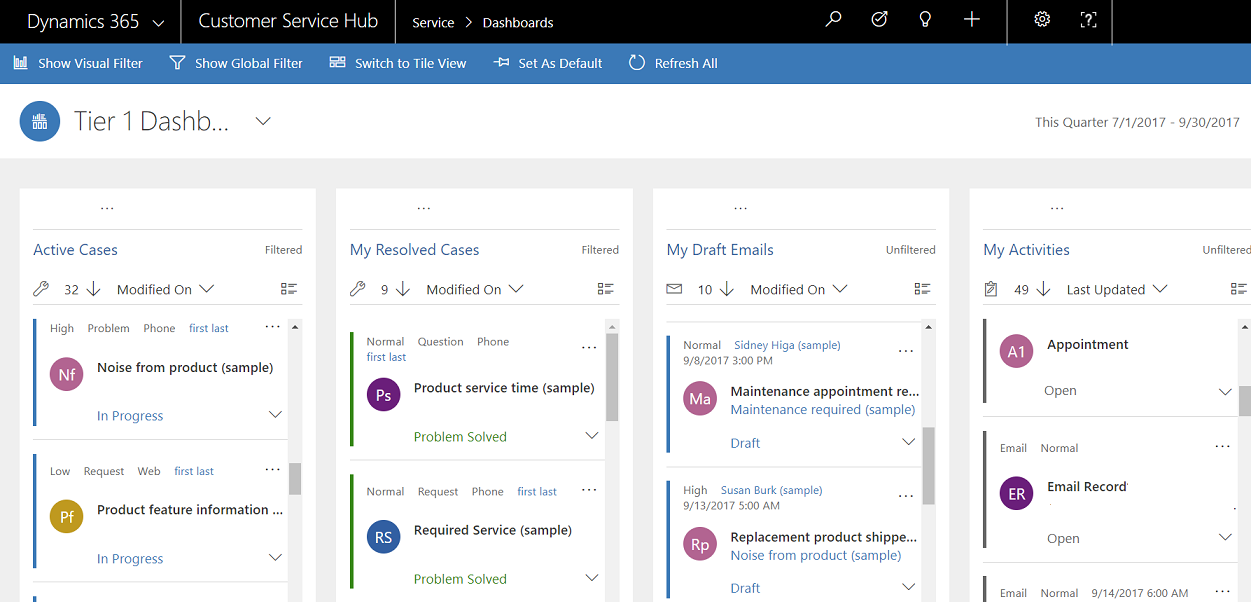
The following illustration shows the multi-stream dashboard without visual filters enabled:
The following illustration shows the multi-stream dashboard with visual filters. You can use the arrows to move the view right or left to see all charts.
Global Filter
To add granularity to filtering data, you can use the Global filter. For example, you can apply the Global filter to show only escalated cases and the cases that are marked as “Request.”
Select the Show Global Filter button in the command bar to view and apply global filters.

When you select the Global filter button, the filter flyout window opens. The entity fields that are preconfigured by your administrator appear in alphabetical order in the flyout window. You can select multiple values in a field, as well as values from multiple fields. Select Apply for the action to take place.
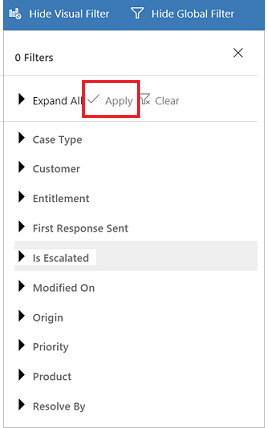
After you apply Global filters, the dashboard refreshes to show you only the cases in charts, streams, and tiles that are based on the filter entity (the filter entity is the entity that is used in the charts). To clear the Global filter, select Clear in the flyout window.
By using a combination of Visual and Global filters, you can drill down from a long list of cases to a more focused list.
You can refer this article docs.microsoft.com/.../configure-interactive-experience-dashboards for creation of Global filter fields.
docs.microsoft.com/.../customer-service-hub-user-guide-dashboard


