web
You’re offline. This is a read only version of the page.
close
Skip to main content

Notifications

Announcements

No record found.

Community site session details

Community site session details

Session Id :
Customer experience | Sales, Customer Insights,...
Unanswered

Chart Shows X Axis Labels as (Blank)

(0) ShareShare
ReportReport
Posted on by 80

Hi all,

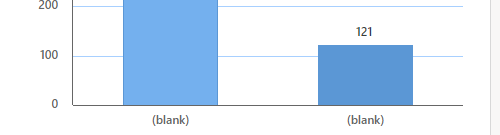
I have created a system chart which has the Legend set to the entity id with count:all and the Horizontal (Category) Axis Labels set to a Yes/No field. When the chart is in the preview mode, it shows the X axis values as Yes/No as expected, but as soon as I publish it and view through the normal front end (using either the Unified Interface Web mode or a Model Driven App) the labels show as (blank). The categories are separated properly so it is seeing the different values.

pastedimage1580402266117v1.png

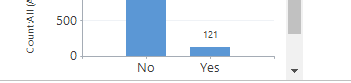
Above image is the preview mode and below image is the 'Live' mode

pastedimage1580402338097v2.png

I have tried:

  • Different Yes/No fields - The result is the same
  • Changing the display text on the field - The result is the same
  • Different field types (int, string, etc) - The chart works as expected
  • Different Browsers - The result is the same
  • Different instances - The result is the same

Has anyone else seen anything similar or have any suggestions as to what can be done to fix this? Any help would be greatly appreciated

Thanks,
Jason

I have the same question (0)
  • lookka Profile Picture
    10 on at

    I'm having the same issue with a personal chart.  Haven't tried making it a system chart yet.  The chart preview looks fine but once saved and viewed in the sales hub, the values are (blank).  There is no issue when loading up the same chart in the old interface.

    chart_2D00_issue.png

  • LuHao Profile Picture
    40,892 on at

    Hi Jason,

    I tested and encountered this issue. I think it is a bug.

    pastedimage1580880097623v1.png

    pastedimage1580880118099v2.png

    I will reflect it to Microsoft team.

    If there is any progress, I will reply here.

  • Qurator Profile Picture
    80 on at

    Hi,

    This has been resolved in a recent patch released by Microsoft.

    Thanks,

    Jason

  • Robert50 Profile Picture
    212 on at

    Any idea what version has the fix so we can monitor our own environment?  Thanks

  • Qurator Profile Picture
    80 on at

    This was fixed in Service Update 135 which they said was released to EMEA on 21st Feb and NA on 28th Feb.

    Hope this helps

  • Robert50 Profile Picture
    212 on at

    Looks like our environment just got 135 over the weekend and my charts are now working as expected.  Do you know where we can check the service update history and scheduled updates for our enviroment besides in the Office 365 health \ message center?  In the power platform admin center, I do see the version 9.1.0.13535 but nothing about when it was installed.

Under review

Thank you for your reply! To ensure a great experience for everyone, your content is awaiting approval by our Community Managers. Please check back later.

Helpful resources

Quick Links

Responsible AI policies

As AI tools become more common, we’re introducing a Responsible AI Use…

Neeraj Kumar – Community Spotlight

We are honored to recognize Neeraj Kumar as our Community Spotlight honoree for…

Leaderboard > Customer experience | Sales, Customer Insights, CRM

#1
Tom_Gioielli Profile Picture

Tom_Gioielli 170 Super User 2025 Season 2

#2
#ManoVerse Profile Picture

#ManoVerse 70

#3
Jimmy Passeti Profile Picture

Jimmy Passeti 50 Most Valuable Professional

Last 30 days Overall leaderboard

Product updates

Dynamics 365 release plans