web
You’re offline. This is a read only version of the page.
close
Skip to main content

Notifications

Announcements

No record found.

Community site session details

Community site session details

Session Id :
Customer experience | Sales, Customer Insights,...
Answered

Dynamics CRM chart

(0) ShareShare
ReportReport
Posted on by

I created a view for case(incident) entity for cases resolved in last 72 Hrs. Used this view to create a column chart to show number of cases resolved in a day. So it will be for last three days. It is working fine. When there are no resolved cases a any of the last three days chart will not the label for that day in X axis. But business want to see the date label with count as 0. And also they want to exclude the Saturdays and Sundays from the days count.

i.e if i am viewing the chart in dash board on Monday (28-Dec) then it should show data for Thursday(24-Dec), Friday(25-Dec) and Monday(28-Dec). These three dates should be shown in X-axis as labels even there are no resolved cases for these dates. Some thing like this - 

 pastedimage1609163709692v1.png

I have the same question (0)
  • Community Member Profile Picture
    on at

    Hi upenmet,

    You can refer following link to make the record that value is 0 show in the chart.

    1.you need create a basic chart, then export it.

     pastedimage1609226332720v1.png

    pastedimage1609226390627v2.png

    2.modify the xml file that download.

    We need replace the highlighted attribute in the fetchcollection of the XML file,

    Original:

     pastedimage1609226717407v3.png

    New:

    pastedimage1609227195435v6.png

    3.Reimport the file after modifying it.

    pastedimage1609226975259v5.png

    Now, it can show record that value is 0 in chart.

    pastedimage1609227300435v7.png

    Regards,

    Leah Ju

    Please mark as verified if the answer is helpful. Welcome to join hot discussions in Dynamics 365 Forums.

  • Community Member Profile Picture
    on at

    Hi Leah Ju,

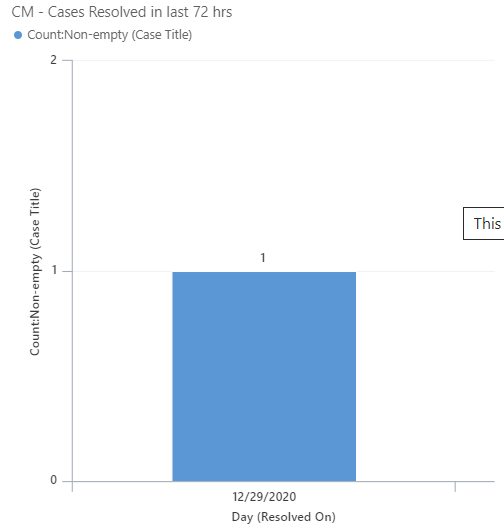
    Thank you for providing the solution. My base chart is same as what you showed here with only 1 difference. I used resolvedon date in place of modifiedon. But it is not working.. I changed the xml by using  xrmtoolbox chart editor as there is no import option in charts for me. we are using Dynamcis CRM 2020 release with wave2.

    My modified code -

     <fetchcollection>

       <fetch mapping="logical" aggregate="true">

         <entity name="incident">

           <attribute name="resolvedon" groupby="true" alias="_CRMAutoGen_groupby_column_Num_0" dategrouping="day" />

           <link-entity name="incident" from="incidentid" to="incidentid" link-type="outer">

             <attribute name="title" aggregate="countcolumn" alias="_CRMAutoGen_aggregate_column_Num_0" />

             <filter type="and">

               <condition operator="eq" value="1" attribute="statecode" />

             </filter>

           </link-entity>

         </entity>

       </fetch>

     </fetchcollection>

    As my view filters data for last 72 Hrs, and today is 29th  i expected it to show 0 count for 27th and 28th 

    pastedimage1609238784795v1.png

  • Verified answer
    Community Member Profile Picture
    on at

    Hi upenmet,

    The Resolve on date field can be filled when case has been resolved, if not, the field is null, so it can’t show in the char.

    You can’t make one value that don’t exist show in the chart.

    Regards,

    Leah Ju

    Please mark as verified if the answer is helpful. Welcome to join hot discussions in Dynamics 365 Forums.

Under review

Thank you for your reply! To ensure a great experience for everyone, your content is awaiting approval by our Community Managers. Please check back later.

Helpful resources

Quick Links

Responsible AI policies

As AI tools become more common, we’re introducing a Responsible AI Use…

Neeraj Kumar – Community Spotlight

We are honored to recognize Neeraj Kumar as our Community Spotlight honoree for…

Leaderboard > Customer experience | Sales, Customer Insights, CRM

#1
Tom_Gioielli Profile Picture

Tom_Gioielli 108 Super User 2025 Season 2

#2
Jimmy Passeti Profile Picture

Jimmy Passeti 50 Most Valuable Professional

#3
Gerardo Rentería García Profile Picture

Gerardo Rentería Ga... 49 Most Valuable Professional

Last 30 days Overall leaderboard

Product updates

Dynamics 365 release plans