Hi ,
I have created a pie chart for booking status and it is looking fine but i want the legend entries to be display at left of pie chart instead of at bottom.
Kindly help me in sorting out this issue.
Thanks.
Hi Humble11Guy,
Unfortunately, you can’t change the color of the chart title if the title is like following screenshot.
In fact, the title is the name attribute of the chart:
And the legend’s name display in short is the space is not enough.
Regards,
Leah Ju
Please mark as verified if the answer is helpful. Welcome to join hot discussions in Dynamics 365 Forums.
Hi Leah Ju,
I was able to get the desired result with your input's already.
Thank you so much for providing the valuable input's.
But i am not able change the color of chart name and legend name's are displaying in short(on the wa...), how can i apply the color to chart title and show the legend name fully.
Thanks.
Hi Humble11Guy,
You can write css with full class name ,just as following screenshot shown:
Now, it shows in the left of the pie and not overlapping.
Regards,
Leah Ju
Please mark as verified if the answer is helpful. Welcome to join hot discussions in Dynamics 365 Forums.
Hi Leah Ju,
Legend-items class is like below
class="highcharts-legend-item highcharts-pie-series highcharts-color-1"
class="highcharts-legend-item highcharts-pie-series highcharts-color-2"
...........
i have written the css like below
.highcharts-legend {
transform: translate(-15px, 10px);
}
.highcharts-legend-item{
transform: translate(15px,10px);
}
.highcharts-legend-item{
transform: translate(15px,30px);
}
.highcharts-legend-item{
transform: translate(15px,50px);
}
.highcharts-legend-item{
transform: translate(15px,70px);
}
.highcharts-legend-item{
transform: translate(15px,90px);
}
.highcharts-legend-item{
transform: translate(15px,110px);
}
.highcharts-legend-item{
transform: translate(15px,130px);
}
.highcharts-legend-item{
transform: translate(15px,150px);
}
.highcharts-legend-item{
transform: translate(15px,170px);
}
When i wrote the css like above it is still overlapping the legends on top of another.
.highcharts-legend {
transform: translate(-15px, 10px);
}
.highcharts-color-0{
transform: translate(15px,10px);
}
.highcharts-color-1{
transform: translate(15px,30px);
}
.highcharts-color-2{
transform: translate(15px,50px);
}
.highcharts-color-3{
transform: translate(15px,70px);
}
.highcharts-color-4{
transform: translate(15px,90px);
}
.highcharts-color-5{
transform: translate(15px,110px);
}
.highcharts-color-6{
transform: translate(15px,130px);
}
.highcharts-color-7{
transform: translate(15px,150px);
}
.highcharts-color-8{
transform: translate(15px,170px);
}
When i wrote like above legends are coming as vertically and in correct way but the problem is pie chart is breaking down like below.
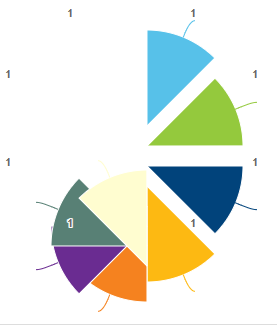
Thanks.
Hi Humble11Guy,
You can ensure that add css to highcharts-legend firstly, then add css to each highcharts-legend-item manually, not use js to set it.
Just like following:
Regards,
Leah Ju
Please mark as verified if the answer is helpful. Welcome to join hot discussions in Dynamics 365 Forums.
Hi Leah Ju,
When i applied the CSS for the legend item in the following way items are overlapping on each other.
.highcharts-legend-item{
transform: translate(-15px,10px);
}
So i have written the javascript to loop through each item and then apply css but it is not working as expected.
$(document).ready(function(){
var legendItems=$('.highcharts-legend-item').get();
$('legendItems').each(function(){
var y=10;
transform.translate(-15, y);
y=y+2;
});
});
Can you please help me in sorting out this issue.
Thanks.
Hi Leah Ju,
I was able to bring the legends at the top of Pie chart, but here problem is it is displaying as in table (2x4) format . Can you please help me how to make those 8 statuses(legends) stacked on one another vertically at top-left.
Thanks.
Hi Humble11Guy,
Yes, you can add Css to customize the position of the Legends in the portal after adding chart to the portal.
you can refer following step to achieve it.
1.clcik F12 in the page that chart exsits and find the legend under ‘Elements’ tab.
2.clcik ‘Edit’ and go ‘Options’ tab and write css.
Change translate value as your need.
.highcharts-legend { transform: translate(120px, 140px); }
3.Refresh page.
Before:
After:
Regards,
Leah Ju
Please mark as verified if the answer is helpful. Welcome to join hot discussions in Dynamics 365 Forums.
Hi Leah Ju,
Thanks for the reply.
Actually i am using this view to display in Dynamics CRM Portal, will Dynamics portal support this one?
Actually i need to customize this one in Dynamics portal.
Thanks.
Hi Humble11Guy,
Through my test in UCI, when we edit chart, the Legends at bottom, but when I click ‘show chart’ button, it displays at the top of the page.
I try to use ‘Advanced Chart Editor’ of XrmToolBox to change it, but which just do in the web client, not in the UCI.
Finally, I find following document, which is the reason that it can’t work in UCI:
The Unified Interface does not fully support chart customization yet.
https://docs.microsoft.com/en-us/power-platform/admin/about-unified-interface
Capabilities not yet on Unified Interface
We released some capabilities of the legacy web client in the Unified Interface that are available in the hybrid experience. You can enable the hybrid experience to get them in the browser client.
There are certain capabilities that continue to be unavailable in the Unified Interface and we are working to provide these in future releases:
Regards,
Leah Ju
Please mark as verified if the answer is helpful. Welcome to join hot discussions in Dynamics 365 Forums.
Stay up to date on forum activity by subscribing. You can also customize your in-app and email Notification settings across all subscriptions.
André Arnaud de Cal... 291,240 Super User 2024 Season 2
Martin Dráb 230,149 Most Valuable Professional
nmaenpaa 101,156