web
You’re offline. This is a read only version of the page.
close
Skip to main content

Announcements

No record found.

News and Announcements icon
Community site session details

Community site session details

Session Id :
Customer experience | Sales, Customer Insights,...
Suggested Answer

Add a gauge chart or other types of graph

(0) ShareShare
ReportReport
Posted on by 75

Hi everyone!

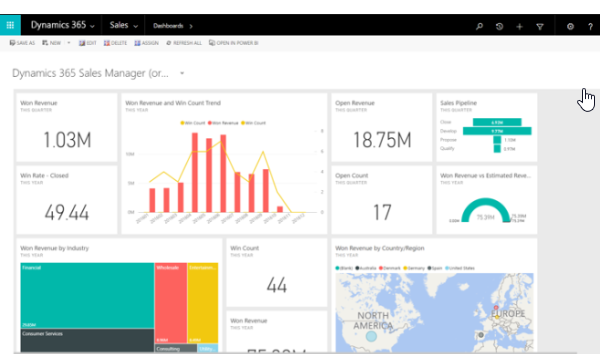
I am looking for add a graph "speedmeter graph" for example, or other types of graph that i cant see in the graph types that dynamics 365 offer when i make one, but I can see it in the Microsoft sites dashboards like this.

7853.pastedimage1590159900992v1.png

But really I dont know how can do it.

Some one could be helpme?

Thanks in advance

I have the same question (0)
  • Suggested answer
    Mark Carrington Profile Picture
    334 on at

    The example here is using an embedded Power BI report - this is the best way of producing this sort of visualisation.

  • Suggested answer
    ManishChouhan Profile Picture
    145 on at

Under review

Thank you for your reply! To ensure a great experience for everyone, your content is awaiting approval by our Community Managers. Please check back later.

Helpful resources

Quick Links

Introducing the 2026 Season 1 community Super Users

Congratulations to our 2026 Super Stars!

Meet the Microsoft Dynamics 365 Contact Center Champions

We are thrilled to have these Champions in our Community!

Congratulations to the April Top 10 Community Leaders

These are the community rock stars!

Leaderboard > Customer experience | Sales, Customer Insights, CRM

#1
ManoVerse Profile Picture

ManoVerse 73 Super User 2026 Season 1

#2
Muhammad Shahzad Shafique Profile Picture

Muhammad Shahzad Sh... 69 Most Valuable Professional

#3
11manish Profile Picture

11manish 50

Last 30 days Overall leaderboard

Product updates

Dynamics 365 release plans