web
You’re offline. This is a read only version of the page.
close
Skip to main content

Notifications

Announcements

Community site session details

Community site session details

Session Id :
Microsoft Dynamics NAV (Archived)
Suggested Answer

DIMENSIONS -Begin total and End total -

(0) ShareShare
ReportReport
Posted on by

Hello!

I am doing sales analysis reports using dimensions to filter data. What I did, as you can see below, when I created dimensions, is to use the tool "begin total" and "end total" . The problem is, as perhaps I understood wrong how this whole begind-end total works, is that when I choose the dimension code corresponding to the end total, I dont get all the results that would be in that range but none. Does that mean I have to assign two codes to each item? the individual code, and the code corresponding to "end total"? Unbenannt6.png

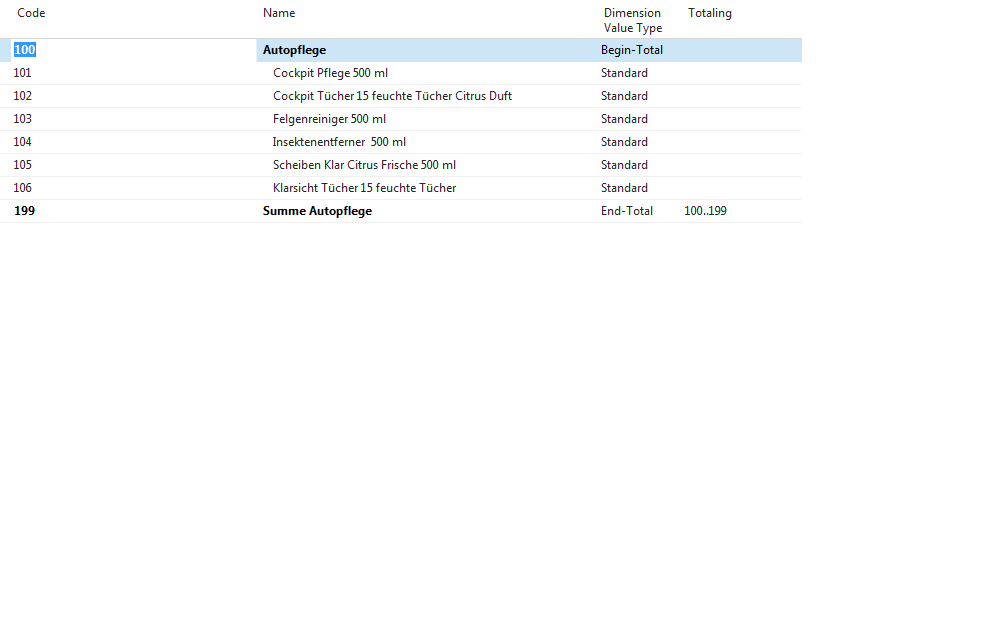
*This post is locked for comments

I have the same question (0)
  • Community Member Profile Picture
    on at

    hi,

    If I have understood you correctly, when you have built the dimension report, you have added a filter to the "end total" line, but there are no filters on the "standard" lines?

    If this is the case, then you have slightly misunderstood how to build the report.

    Remove the filter from your report and then re-run it. When you re-run it, I would expect you to be able to add the filter to the report (as you run the report, not as you build the report layout), which will then give you the values you are expecting (depending on how you have built the dimension structure).

    Alternatively, you could add the dimension filter to each "standard" line, but I wouldn't recommend that you do this, as you will have to build multiple reports for each combination of dimensions that you want to report on.

    hope that makes sense, let me know if not

  • Community Member Profile Picture
    on at

    Unbenannt10.png

    Thanks for your answer Sir,

    What I meant, is that before running a sales analysis report, I could define in the sales analysis lines what dimensions I want to be shown in the report. For example I have a custom template where the range  is all the items we have in our database, and the dimension 1 and 2 are respectively "group of items" and "customers". So, I was expecting that by just changing the values of these two dimensions I could "filter" for the information I want to get i.e give me all the items corresponding to the group "Autopflege" that have been sold to customer "x".

    This template I created, as fas as I understood the sales analysis report, is to me "all articles we have, with the options to filter them for groups and customers".

    So I was expecting to be able to get a value corrsponding to the sum of all products contained in a product group, by writing the dimension code that corresponds to end-total.

    Please see attached the screenshot. the number '199' relates to the sum of all products contained in autoplfege.

  • Community Member Profile Picture
    on at

    hi,

    you are right, but you need cannot add the '199' filter against an end total. Just let the end total be blank, but allow the line to have the 199 filter.

    And if you are new to the sales analysis dimensions, have you rebuilt the data? (I.e. if this is a new query, I think you will have to build the sales analysis cube first)

  • Community Member Profile Picture
    on at

    Hi, what you mean by  "let the end total be blank, but allow the line to have the 199 filter" ?

    Sales analysis cube? I have the columns set up, if I choose one item number I am able to see Direct costs, COGS, profit, quantity..for that product

  • Community Member Profile Picture
    on at

    have a look at 

    https://msdn.microsoft.com/en-us/library/hh167911(v=nav.90).aspx

    This should give you a steer, but happy to answer if you get stuck.

  • Community Member Profile Picture
    on at

    mmm I think we are not understanding each other. I dont want to do a sales report analysis through the so called "sales anlysis by dimensions", but a sales report from "sales analysis report" , where I can add formulas etc etc. I dont think I need to create any cube for that.  All I want to know, is  where that end-total code for a dimension can be used or why it doesnt work in the sales analysis report

  • Suggested answer
    Community Member Profile Picture
    on at

    Try using 101..198 in  Product Totaling Field  (Instead of 199) and see if it helps. Ideally, it should work.

  • Community Member Profile Picture
    on at

    Yes, that works, but then whats the purpose of code 199?  just to delimit a range?

  • rhansen Profile Picture
    2 on at

    We take a different approach generally with our customers (we are a NAV reseller).  We will normally set up two separate dimensions - one for the lower level/detailed values, then a separate dimension for the higher-level categories.  This structure proves to be more flexible for analysis.  We also sell an ISV add-on for NAV called DimensionPath that greatly extends dimension capabilities.  One of its functions is "Dimension Relations" which tie in here.  It enables each of the lower-level dimension values to have a dimension "Relation" defined up to the higher-level dimension value (which is a separate dimension).  Once that's defined, anytime the lower-level dimension value is entered on a transaction, NAV automatically defaults in the higher-level dimension value (so users do not have to select both separately).  It allows these relationships to be defined as "Firm" (which would then prevent the user from changing the higher-level value, to keep the mapping in sync and strict) or "Flexible" (where the related dimension value is a default but the user WOULD be able to override it).

    We use dimensions very heavily in our projects.  They're a fantastic tool, and once people really understand the capabilities around them (and with some of the extensions that we've built into DimensionPath) so that they are fully leveraged, the value they get out of NAV goes up significantly.

  • Suggested answer
    Community Member Profile Picture
    on at

    That is normally being used for grouping purpose and would give the accurate results in "Analysis By Dimension"  screen.

    In Sales Analysis Report, it works differently by applying other formulas as mentioned above.

Under review

Thank you for your reply! To ensure a great experience for everyone, your content is awaiting approval by our Community Managers. Please check back later.

Helpful resources

News and Announcements

Season of Giving Solutions is Here!

Quick Links

Responsible AI policies

As AI tools become more common, we’re introducing a Responsible AI Use…

Neeraj Kumar – Community Spotlight

We are honored to recognize Neeraj Kumar as our Community Spotlight honoree for…

Leaderboard > 🔒一 Microsoft Dynamics NAV (Archived)

#1
HoangNam Profile Picture

HoangNam 7

Last 30 days Overall leaderboard

Featured topics

Product updates

Dynamics 365 release plans