


 310
310 Like
Like Share
Share
 Report
Author Note
All content, including samples, images and writings can be found in my GitHub repo.
This specific article appears here.
Revisions
02/12/2023 - Fixed images, updated titles.
Summary
Power Apps Canvas Apps represent a no or low code approach to building and delivering modern applications for makers. The requirements of knowing programming languages such as C# have been removed allowing makers of virtually any background to build apps. These apps can be used with hundreds of connectors allowing for a flexible user interface layered on top of data sources. Apps can also be generated from data sources automatically allowing you to quickly create and deploy an application to your team or customers.
This article is designed to introduce makers to incorporating Azure Application Insights into Power Apps Canvas Apps. We will cover adding the necessary identifiers, reviewing the tables events are sent to and examine some helpful Kusto queries.
Application Insights
Azure Application Insights is an extensible Application Performance Management (APM) service that can be used to monitor applications, tests, etc. Azure Application Insights can be used with any application hosted in any environment. Depending on what's being monitored there are SDKs available. For other applications connections and message delivery can be programmed using the REST APIs available.
For Power Platform components, Application Insights is recommended due to its direct integration with Power Apps features and tools and its capabilities to deliver to the API.
Once we begin sending telemetry to Application Insights we can review in real time availability tests, user actions, deployment metrics as well as other feedback from our applications. Connecting our messages with correlation identifiers allows us a holistic view into how our apps are interdependent upon each other. This provides the transparency desired and honestly needed with modern era technology.
Adding Application Insights to Canvas Apps
Adding Azure Application Insights message delivery is a native feature of Power Apps Canvas Apps. Once added it will begin to send messages from both the preview player and once deployed, your application in Power Apps. This article from
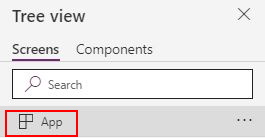
To add the Instrumentation Key to your Canvas App, open the Power Apps Studio and locate the 'App' in the Tree view.
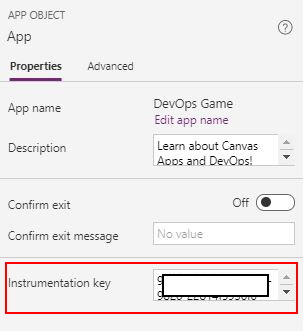
Next, in the App Object window to the right, add the Azure Application Insights Instrumentation Key.
Adding and Locating Identifiers
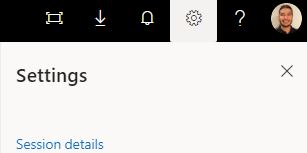
Identifiers in Canvas Apps come in various formats including the user playing the app, the session id, the player version, app version, etc. These data elements are a must when troubleshooting and monitoring how your users interact with your app. Some of the data points I find valuable are the app and player build numbers which are key to understanding if users are using out of date player versions. The other major data point is the session id. For an app user, to obtain these values, navigate to the Settings window and click 'Session details'.
Session Window:
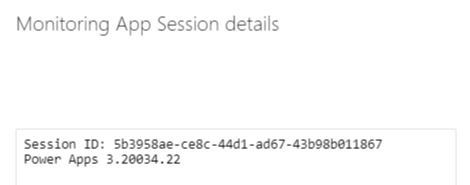
If a user reports an issue, having the session id and Power Apps player version can help with troubleshooting. That said, currently I don't see a way to grab the session id natively using Canvas App functions. However, using the Power Apps connector with Power Automate, the session Id can be obtained and added to a trace entry.
AUTHOR'S NOTE: This article from Aengus Heaney titled "Log telemetry for your Apps using Azure Application Insights
Adding Traces
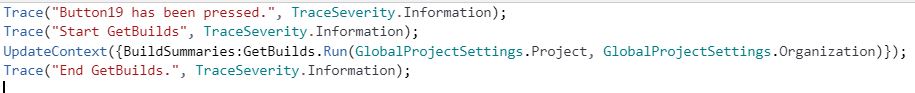
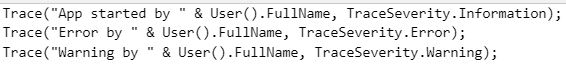
The Trace function is used to send messages to the traces table in Application Insights. This allows makers the ability to add telemetry and instrumentation from practically any control on any screen. This also opens us up to generating identifiers for specific actions which can be used for troubleshooting in a live environment. The below image shows using informational traces to capture the timings between the invocation of a Power Automate flow. The image shows a trace for the button click, and entries for adding instrumentation for a Power Automate flow.
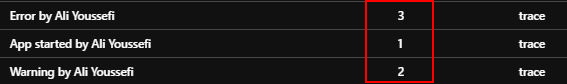
The image below is the result of the Trace methods showing the message and the time stamp for each entry.
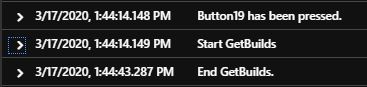
Traces can three types: Information (for operational activities), Warnings (non breaking issue), or Errors (breaking issue).
Based on the severity level, the Application Insights record will change.
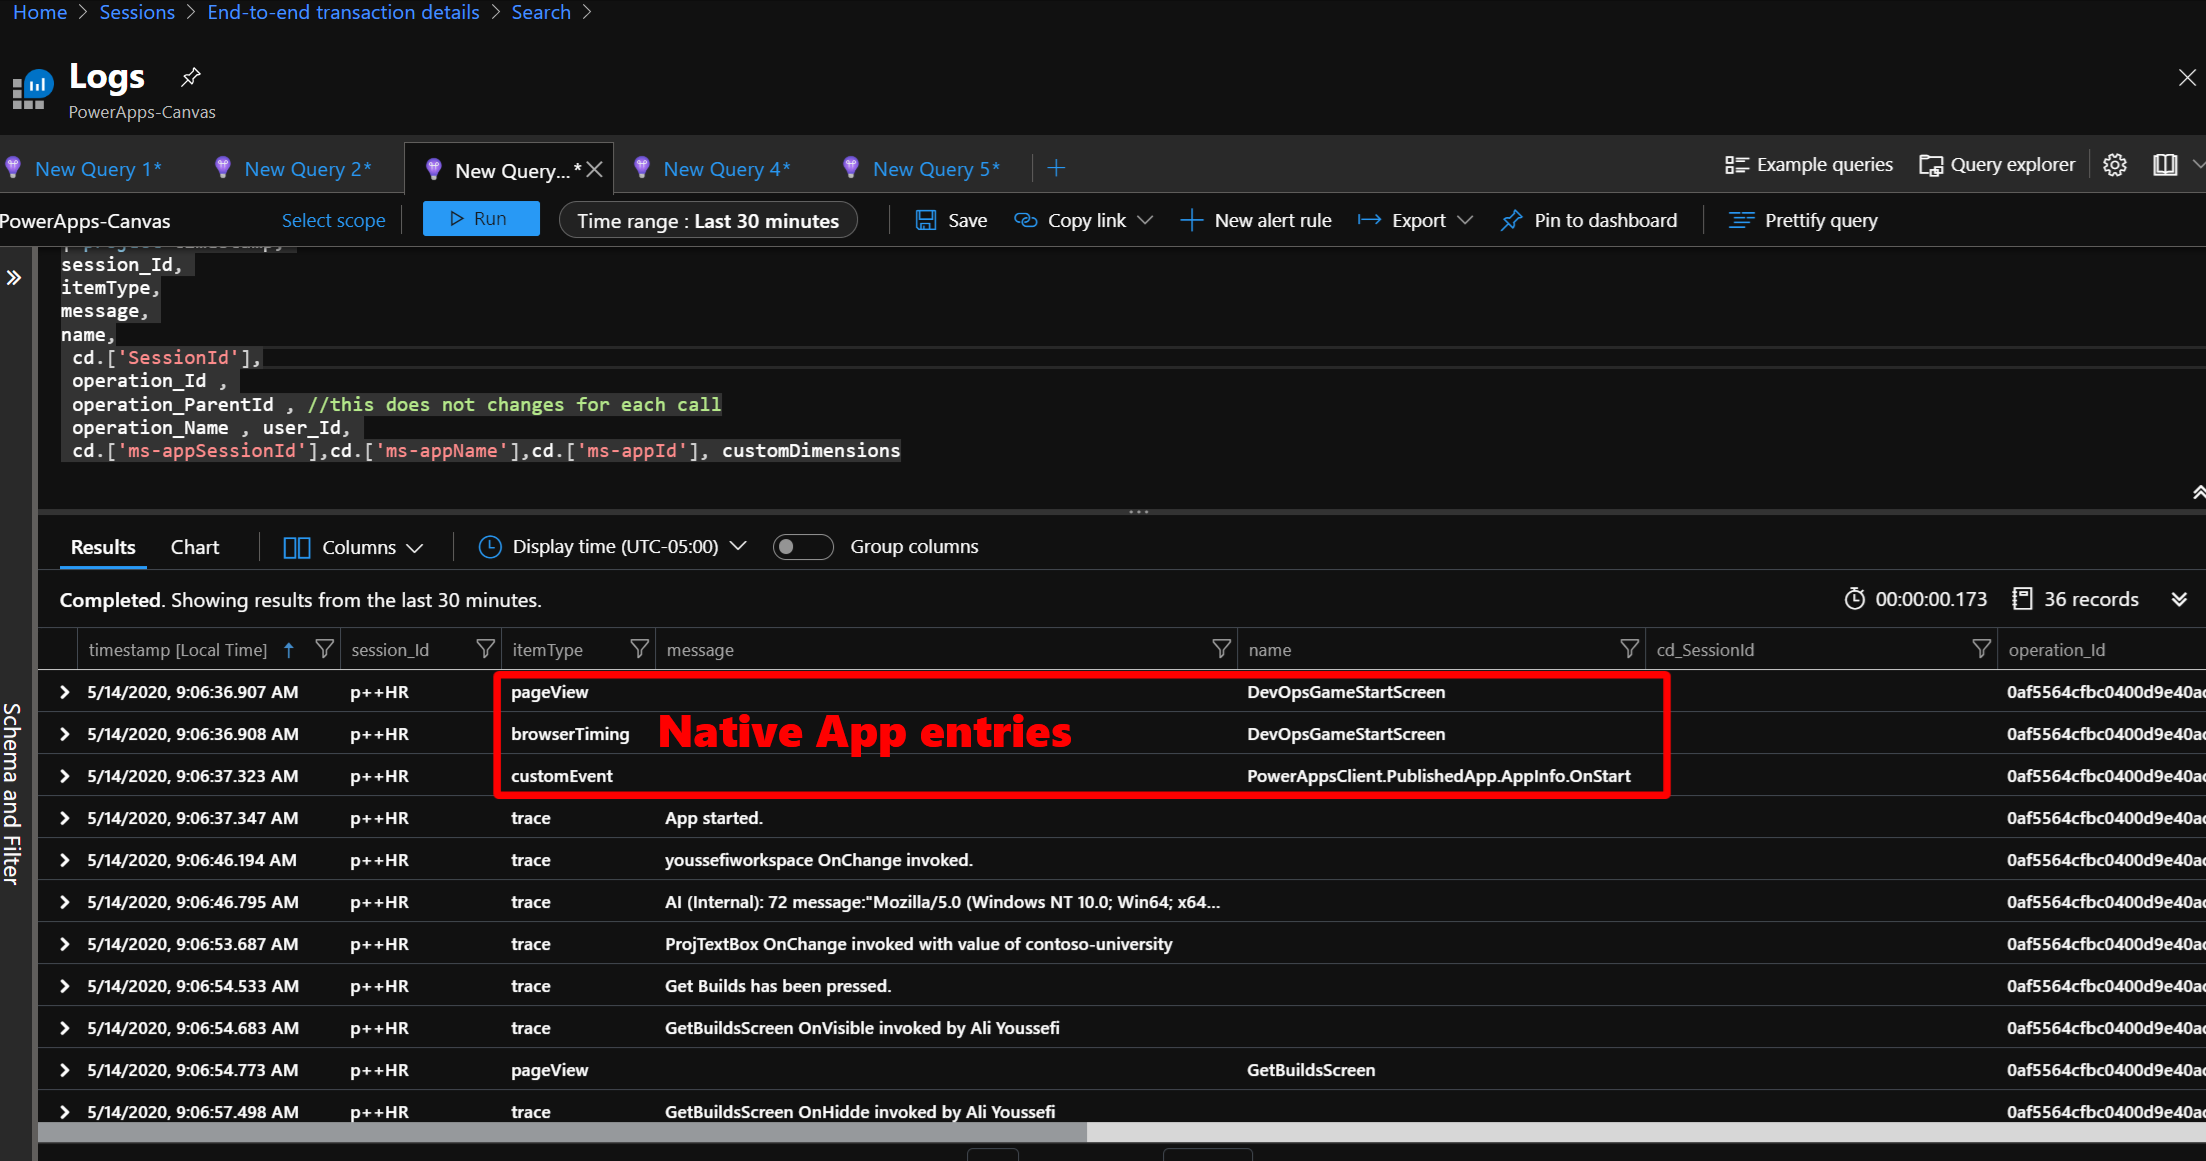
Exploring what's delivered
At the time of this writing the tables data is delivered to natively include the customEvents, pageViews and browserTimings tables. Each table contains generic Azure Application Insights properties as well as specific relevant properties.
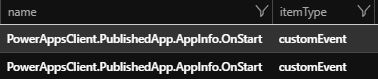
The customEvents table shows when the published app was started.
pageViews - The pageViews table is included when Azure Application Insights is added to Canvas Apps. The message received by Application Insights contains the URL, the name of the screen within your app and the duration as well as a handy performance bucket. Using the duration along with contextual information from the session and user we can begin to identify performance concerns.
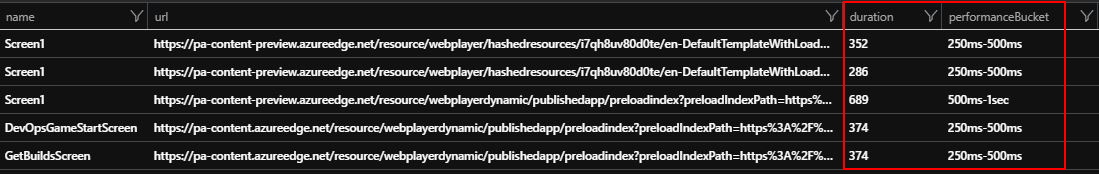
NOTE: I have seen the pageViews duplicate duration across all screens. Consider adding trace events in the Maker Defined Events section or a technique to find the difference between pageView entries in Kusto.
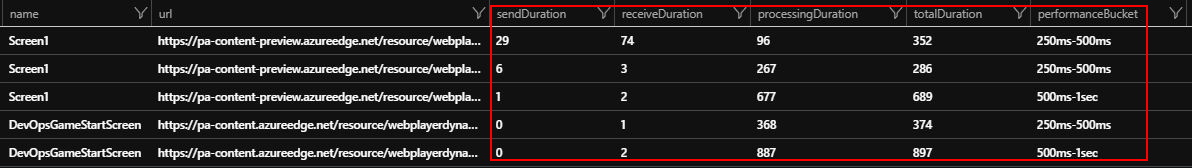
browserTimings - This represents browser interactions including the send and receive duration, the client processing time and the all up total duration. Similar to the pageViews table a performance bucket is present allowing for a general visualization.
Maker Defined Events
The traces table contains information sent from the app by the platform and the maker using the Trace() method. For the platform trace events, the user agent string and client information is captured. For the trace method, as shown above an enumeration is used to set the severity from the Canvas App. In Application Insights this translates to a number.
Useful Kusto Queries
The Kusto Query Language allows analysts to write queries for Azure Application Insights. Below I've included some queries to help you get started with each table events are currently delivered to.
Pulling ms-app identifiers from custom dimensions:
//This query shows how to parse customDimensions for the app identifiers
traces
| union pageViews, customEvents, browserTimings
| extend cd=parse_json(customDimensions)
| project timestamp,
itemId, //this changes for each call
itemType,
operation_Id , operation_ParentId , //this does not changes for each call
operation_Name , session_Id , user_Id,
message, cd.['ms-appSessionId'],cd.['ms-appName'],cd.['ms-appId']
?
Pulling Page Views within the same session:
//This query shows how to use a session_id to follow a user's path in the canvas app
pageViews
// | where session_Id == "f8Pae" //Windows 10
// | where session_Id == "YhUhd" //iOS
| where (timestamp >= datetime(2020-05-13T10:02:52.137Z) and timestamp <= datetime(2020-05-14T12:04:52.137Z))
Slow Performing Pages or screens:
// Slowest pages
// What are the 3 slowest pages, and how slow are they?
pageViews
| where notempty(duration) and client_Type == 'Browser'
| extend total_duration=duration*itemCount
| summarize avg_duration=(sum(total_duration)/sum(itemCount)) by operation_Name
| top 3 by avg_duration desc
| render piechart
Connecting the Dots
The Power Apps Canvas App platform provides app contextual information for each event passed to Application Insights. These include operation name, operation and parent operation identifiers as well as user and session data. Most messages also include custom properties titled ms-appId, ms-appName and ms-appSessionId.
The following Kusto query is an example showing how to isolate for specific operations by a user in a player session. Using the session_id field, we can filter the specific action, which may have generated multiple events, and group them together.
union (traces), (requests), (pageViews), (dependencies), (customEvents), (availabilityResults), (exceptions)
| extend itemType = iif(itemType == 'availabilityResult',itemType,iif(itemType == 'customEvent',itemType,iif(itemType == 'dependency',itemType,iif(itemType == 'pageView',itemType,iif(itemType == 'request',itemType,iif(itemType == 'trace',itemType,iif(itemType == 'exception',itemType,"")))))))
| where
(
(itemType == 'request' or (itemType == 'trace' or (itemType == 'exception' or (itemType == 'dependency' or (itemType == 'availabilityResult' or (itemType == 'pageView' or itemType == 'customEvent'))))))
and
((timestamp >= datetime(2020-04-26T05:17:59.459Z) and timestamp <= datetime(2020-04-27T05:17:59.459Z))
and
session_Id == 'tmcZK'))
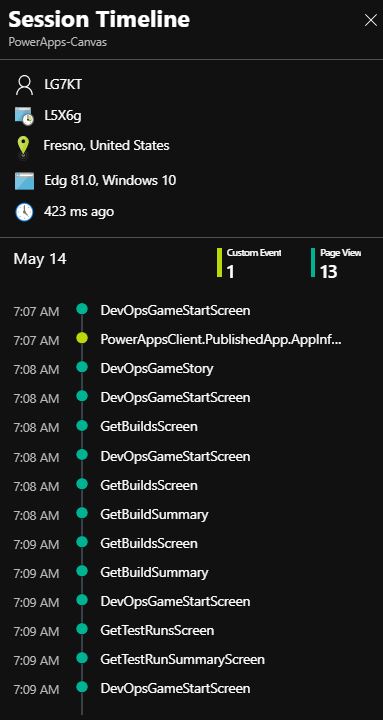
| top 101 by timestamp descApplication Insights contains a User Session feature that can help visualize and provide data points for the specific session. The image below combines custom events and page views.
Next Steps
The native functionality of Azure Application Insights traceability is a relatively new feature for Canvas Apps. I would also expect to see additional messages delivered to missing tables above such as exceptions and custom metrics. In the meantime consider using a Power Automate flow to send events, a custom connector or the Log Analytics Data Collector connector. This connector requires a P1 license but does allow to send data to a Log Analytics workspace which can be queried and monitored by Azure Monitor and other platforms.
Utilizing the Azure Application Insights API Key, Microsoft Power BI reports can be created based off the data collected from Power Apps Canvas Apps. Consider using the M Query export or building custom queries using the Application Insights API.
If you are interested in learning more about specialized guidance and training for monitoring or other areas of the Power Platform, which includes a monitoring workshop, please contact your Microsoft representative for further details.
Your feedback is extremely valuable so please leave a comment below and I'll be happy to help where I can! Also, if you find any inconsistencies, omissions or have suggestions, please go here to submit a new issue.
Index
*This post is locked for comments