The Data Management Framework (DMF) is the workhorse behind many data integrations in Dynamics 365 Finance and Supply Chain Management — import projects, export projects, recurring data jobs, and entity-based data movement. Until now, monitoring DMF executions has been an exercise in opening the Data management workspace, drilling into job history, and stitching together what happened across staging and target by hand.
With the new DMF telemetry signals in Application Insights, you can now monitor DMF execution end-to-end — start and end times, records moved per entity, staging and target counts, errors with the originating staging RecId — and build dashboards and alerts on top of it.
In this post, we walk through the new signals, share the KQL queries you can use to surface them, and provide a ready-to-import FastTrack accelerator dashboard for Azure Data Explorer so you can get value within minutes.
Enabling DMF telemetry
DMF telemetry is generally available. Once Application Insights is wired up for your finance and operations environment, the new DMF signals appear under the Configure tab in the Monitoring and Telemetry settings — enable them there to start ingesting events. No flights, support tickets, or preview registration are required.
For the basics of enabling Application Insights for finance and operations, see Get started with monitoring and telemetry. Reference documentation for DMF telemetry is available here.
What this telemetry helps you answer
Before we dive into the KQL, here is the kind of question DMF telemetry — and the accompanying dashboard — is designed to put a number on:
- Throughput — Which entities and data projects move the most records, and how does that change over time?
- Performance — Which DMF executions are the slowest? Which data projects have the worst time-per-record? Was yesterday's run actually slower than usual?
- Stability — Are there runs that started but never finished? Are errors spiking, and on which project?
- Triage — When a load fails, which staging record was at fault, and which batch job / activity owned it?
- Multi-environment monitoring — Can I see Dev, Test and Prod side by side in one workspace without losing isolation?
- Capacity planning — Given current volumes and timings, what is my effective records-per-second per entity, and where do I need to invest in tuning?
The queries and tiles below map directly to these questions.
Querying the DMF telemetry
If you are new to using Application Insights, first have a look at Analyze and monitor telemetry with KQL to get started with KQL queries against the customEvents table.
The following DMF event names are emitted to customEvents:
| Event name | Purpose |
|---|
DMFImportJobStart / DMFExportJobStart | Logged when a DMF job starts |
DMFImportJobEnd / DMFExportJobEnd | Logged when a DMF job ends — drives duration tracking |
DMFError | Logged on a DMF error, includes ErrorMessage and the originating StagingRecId |
The interesting payload lives in customDimensions. Useful fields include:
ExecutionId, DataProjectName, EntityName, LegalEntity, ExecutionMode, BatchJobId, BatchJobCaption, TotalNumberOfRecords, NumOfStagingNew, NumOfTargetNew, NumOfTargetUpdated, StagingStatus, TargetStatus, StagingErrorCount, TargetErrorCount, StagingRecId, ErrorMessage, DMFOperationType, activityId, environmentId, aadTenantId.
All of the queries below are already packaged into the sample dashboard available through our GitHub repository — see the FastTrack sample accelerator dashboard for DMF section further down for download and import instructions.
Base query: parsing DMF events
To keep every tile short and readable, the dashboard relies on a single base query — exposed as allDMFEvents — that flattens the relevant customDimensions fields into typed columns and derives a direction (Import/Export) for every event by joining back to the originating JobStart record. The shape is roughly:
let DmfEvents =
customEvents
| where name startswith "DMF"
| where timestamp between (_startTime .. _endTime)
| extend cd = parse_json(customDimensions)
| extend ExecutionId = tostring(cd.ExecutionId)
| extend EntityName = tostring(cd.EntityName)
| extend DataProjectName = tostring(cd.DataProjectName)
// ... + the other custom dimensions, then a leftouter join
// against DMFImport/ExportJobStart to attach 'direction'
;
The full base query also honours the dashboard parameters (_environmentId, entityName, dataProject, executionId, _activityId) so that every tile inherits the same filters. The _environmentId parameter in particular lets the same dashboard target multiple environments stored in the same Application Insights workspace — a common pattern when Dev/Test/Prod share telemetry.
We've intentionally kept the full body out of this post: a few small simplifications to it are incoming in the next dashboard release, and once shipped the base query will be noticeably shorter. The current version will remain fully compatible with the DMF telemetry signals, so there is no need to rush an upgrade. The authoritative version is always the one in the dashboard JSON on GitHub.
In the queries below, assume the dataset above is available as allDMFEvents.
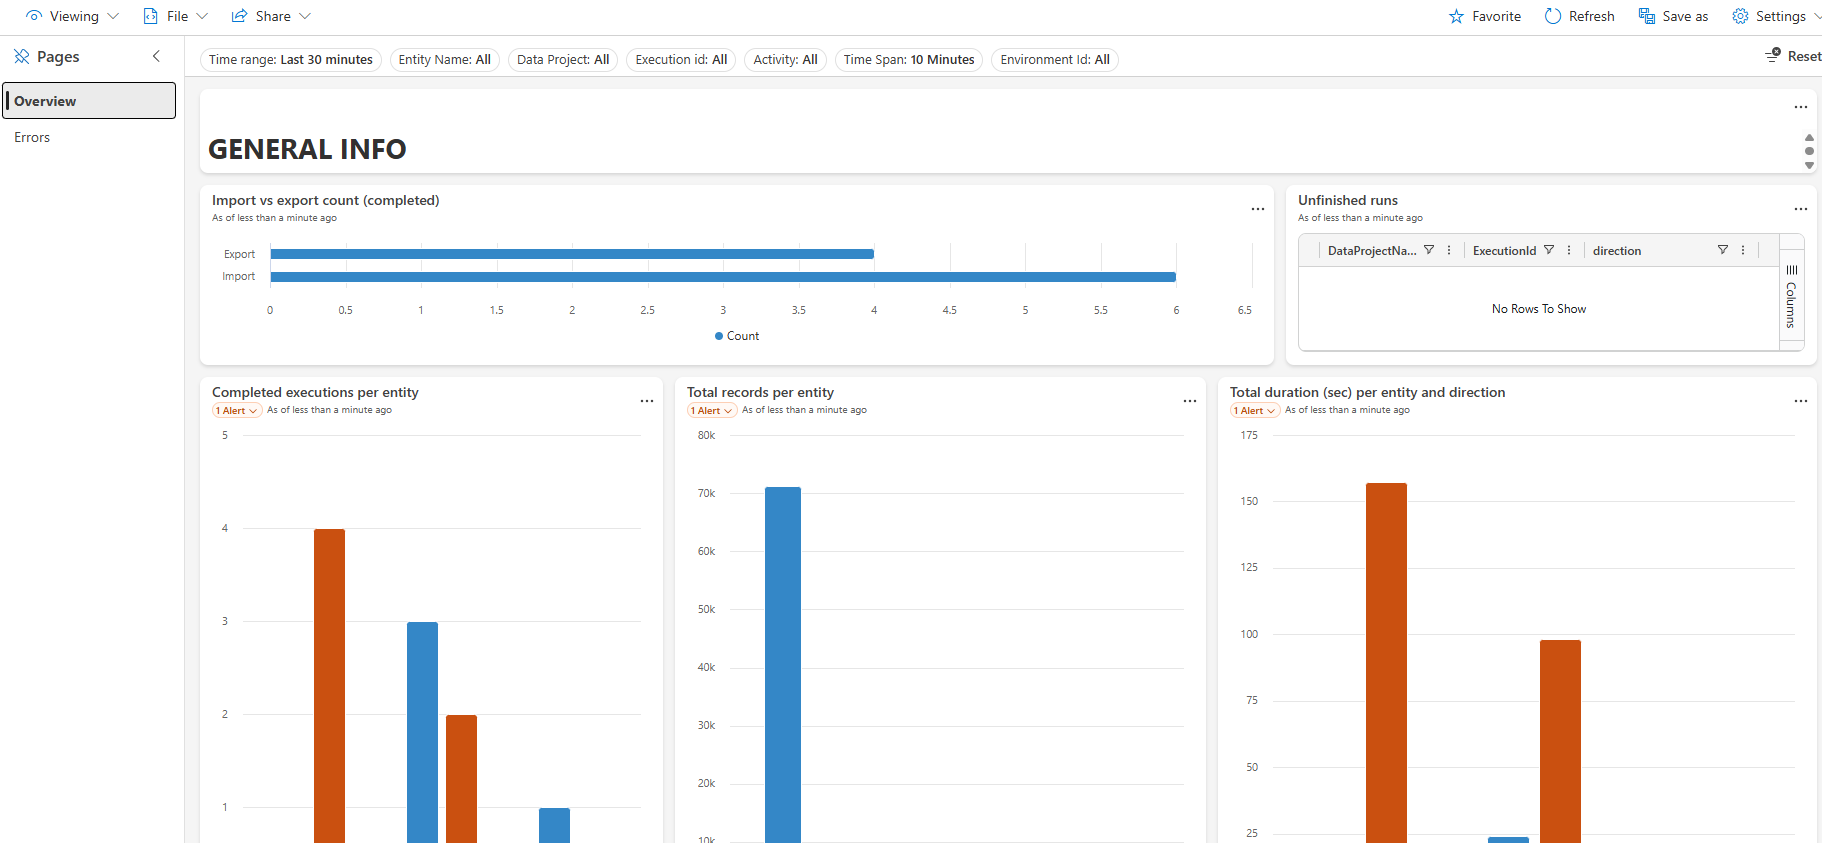
Import vs export count
🎯 Scenario: "How many DMF executions completed today, and what's the import-vs-export mix?"
A quick top-line number: how many DMF executions completed in the time window, broken down by direction.
allDMFEvents
| where name == "DMFExportJobEnd" or name == "DMFImportJobEnd"
| summarize Count = count_distinct(ExecutionId) by direction

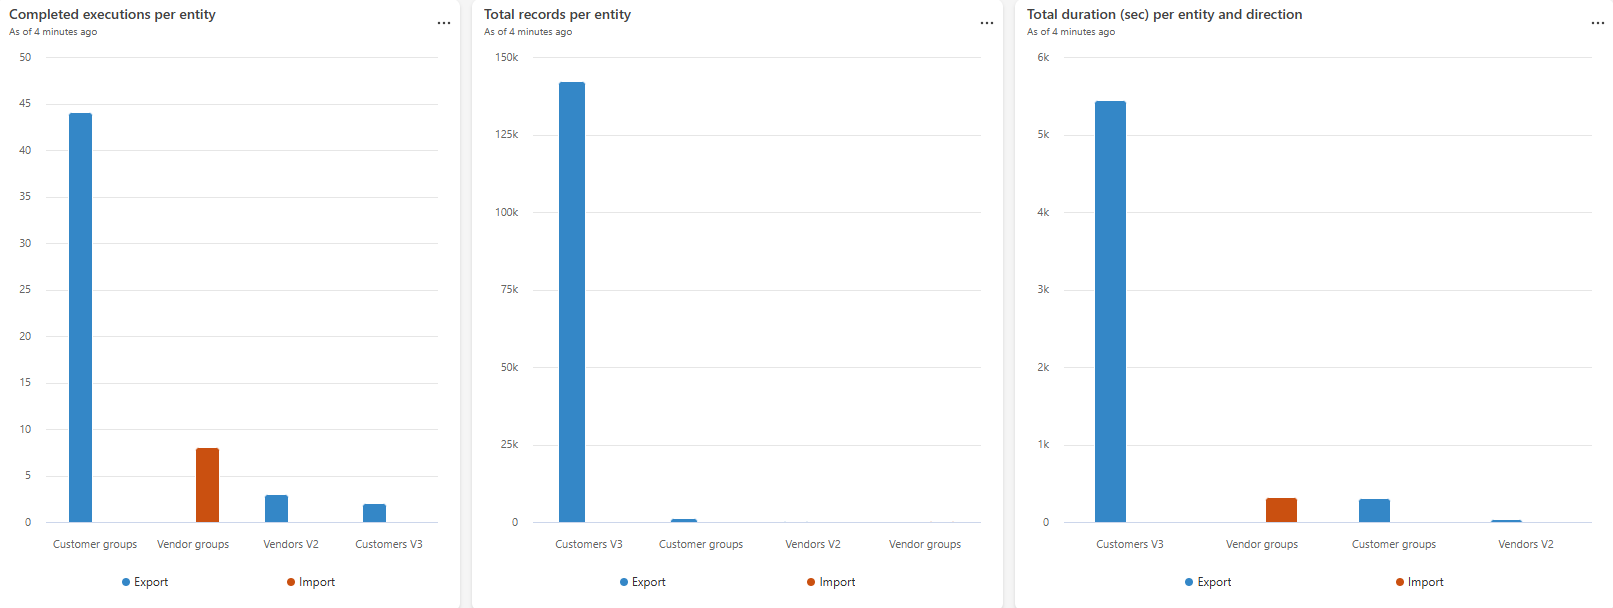
Per-entity tiles: executions, records and duration
🎯 Scenario: "Which entities drive my DMF workload — by execution count, by records moved, and by total processing time?"
The next three tiles answer the most common DMF profiling questions at a glance: which entities are processed most often, how many records they move, and how much wall-clock time they consume. Reviewing them side by side is usually enough to spot the dominant workload and the candidates for tuning.
Completed executions per entity — workload profile and baseline before tuning entity-specific imports.
allDMFEvents
| where name == "DMFExportJobEnd" or name == "DMFImportJobEnd"
| summarize NumberOfExecutions = count() by EntityName, direction
| order by NumberOfExecutions desc
Total records per entity — best single signal for capacity-planning conversations; combine with duration to estimate effective throughput per entity.
allDMFEvents
| where name == "DMFExportJobEnd" or name == "DMFImportJobEnd"
| summarize sum(TotalNumberOfRecords) by EntityName, direction
| order by sum_TotalNumberOfRecords desc
Total duration (sec) per entity and direction — where the bulk of DMF processing time is spent.
allDMFEvents
| where name in ("DMFImportJobStart","DMFImportJobEnd","DMFExportJobStart","DMFExportJobEnd")
| summarize Duration = max(timestamp) - min(timestamp) by EntityName, ExecutionId, direction
| extend DurationInSec = Duration / 1s
| summarize DurationInSec = toint(sum(DurationInSec)) by EntityName, direction
| order by DurationInSec desc
Executions by duration
🎯 Scenario: "Which individual DMF runs took the longest? Did anything regress versus last week?"
Top-100 slowest DMF executions in the window.
allDMFEvents
| where name in ("DMFImportJobStart","DMFImportJobEnd","DMFExportJobStart","DMFExportJobEnd")
| summarize Duration = max(timestamp) - min(timestamp),
Start = min(timestamp),
End = max(timestamp),
LegalEntity = take_any(LegalEntity),
Records = max(TotalNumberOfRecords),
ActivityId = take_any(activityId),
Direction = take_any(direction)
by EntityName, ExecutionId
| order by Duration desc
| limit 100
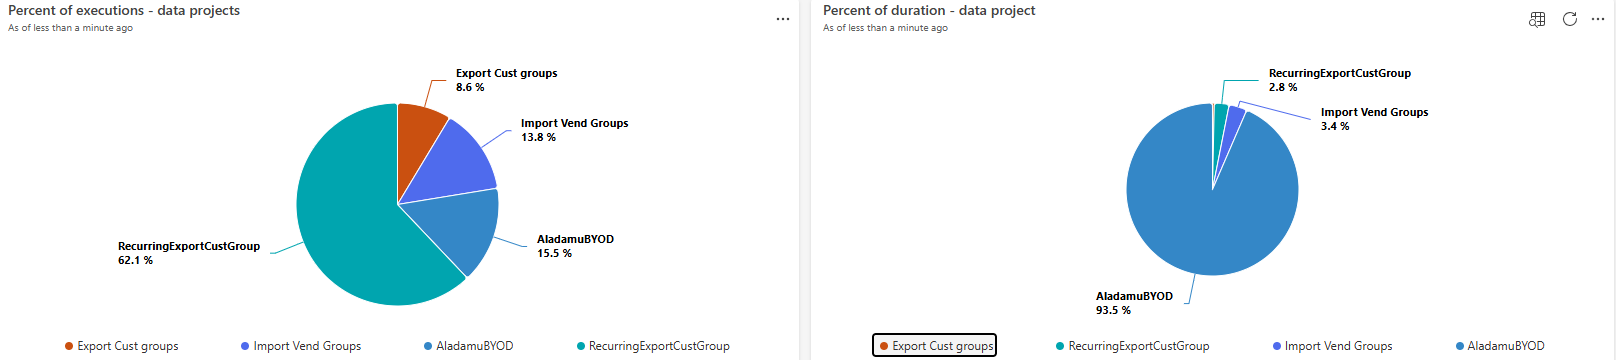
Data project share of executions and duration
🎯 Scenario: "Is my DMF workload concentrated on one data project, or spread across many?"
Once the per-entity picture is clear, the next question is usually "which data projects are driving it?".
// Percent of executions - data projects
allDMFEvents
| where name == "DMFExportJobEnd" or name == "DMFImportJobEnd"
| summarize NumberOfExecutions = count() by DataProjectName, direction
| order by NumberOfExecutions desc
// Percent of duration - data project
allDMFEvents
| where name in ("DMFImportJobStart","DMFImportJobEnd","DMFExportJobStart","DMFExportJobEnd")
| summarize Duration = max(timestamp) - min(timestamp) by DataProjectName, ExecutionId, direction
| extend DurationInSec = Duration / 1s
| summarize DurationInSec = toint(sum(DurationInSec)) by DataProjectName, direction
| order by DurationInSec desc
Average record processing duration by data project
🎯 Scenario: "Which data projects are disproportionately expensive per record, regardless of how big they are?"
A normalised throughput view — average time per record, grouped by data project.
allDMFEvents
| where name in ("DMFImportJobStart","DMFImportJobEnd","DMFExportJobStart","DMFExportJobEnd")
| summarize Duration = max(timestamp) - min(timestamp),
Records = max(TotalNumberOfRecords),
Direction = take_any(direction)
by DataProjectName, ExecutionId
| summarize ['AVG duration per record'] = sum(Duration) / sum(Records) by DataProjectName, Direction
| order by ['AVG duration per record'] desc
| limit 100

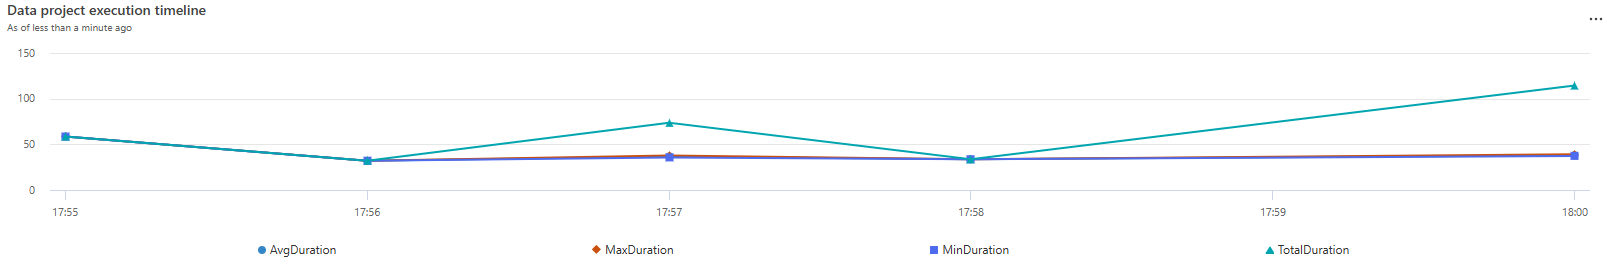
Data project execution timeline
🎯 Scenario: "The customer says yesterday's integration was slower — was it really, and by how much?"
When a customer reports "the integration was slower yesterday", a timeline view of total/average/min/max duration per bin is usually the fastest way to confirm and frame the conversation.
allDMFEvents
| where assert(tobool(dataProject <> ''), "Data project name is needed!")
| where DataProjectName == dataProject
| where name in ("DMFImportJobStart","DMFImportJobEnd","DMFExportJobStart","DMFExportJobEnd")
| summarize StartTime = min(timestamp),
EndTime = max(timestamp),
Duration = max(timestamp) - min(timestamp),
Records = max(TotalNumberOfRecords),
Direction = take_any(direction)
by ExecutionId, LegalEntity
| summarize TotalDuration = sum(Duration),
AvgDuration = avg(Duration),
MinDuration = min(Duration),
MaxDuration = max(Duration)
by bin(EndTime, totimespan(_timeSpan))
Unfinished runs
🎯 Scenario: "Which DMF jobs started but never produced an end or error event? Are any runs silently stuck?"
A safety-net query: executions that emitted a JobStart but never produced a corresponding JobEnd or DMFError.
AllDMFEventsToNow
| where name == "DMFExportJobStart" or name == "DMFImportJobStart"
| distinct DataProjectName, ExecutionId, direction
| join kind=leftanti (
AllDMFEventsToNow
| where name in~ ("DMFExportJobEnd","DMFImportJobEnd","DMFError")
| distinct ExecutionId
) on $left.ExecutionId == $right.ExecutionId
| limit 1000
DMF errors — list
🎯 Scenario: "A load failed — which staging record is at fault, and which batch job / activity owns it?"
All DMF errors in the window, including the originating StagingRecId so you can navigate straight to the offending staging record in F&O.
allDMFEvents
| where name == 'DMFError'
| project timestamp, LegalEntity, user_Id, StagingRecId, ExecutionId, activityId,
ErrorMessage, DataProjectName, EntityName, ExecutionMode,
cloud_RoleInstance, BatchJobId, environmentId, direction
| limit 1000
DMF errors — trend
🎯 Scenario: "Are errors spiking? Should I raise an alert?"
Use this query to spot error spikes and to drive alerts.
allDMFEvents
| where name == 'DMFError'
| where isempty(dataProject) or DataProjectName == dataProject
| where isempty(entityName) or EntityName == entityName
| where isempty(executionId) or ExecutionId == executionId
| summarize NumberOfErrors = count() by bin(timestamp, totimespan(_timeSpan))

Errors per data project
🎯 Scenario: "Which integration should I fix first?"
Top-20 data projects by error count.
allDMFEvents
| where name == 'DMFError'
| summarize count() by DataProjectName, direction
| order by count_ desc
| limit 20

FastTrack sample accelerator dashboard for DMF
With the FastTrack team, we have built an accelerator dashboard that packages all of the queries above into a ready-to-use Azure Data Explorer dashboard. It has an Overview page for throughput and duration analysis and a dedicated Errors page for triage. It also supports an environmentId parameter so you can filter data when multiple environments share the same Application Insights / Log Analytics workspace.

How to import the sample dashboard in Azure Data Explorer
Always import the dashboard into a non-production (test or sandbox) environment first, validate that the visualisations and queries align with your organisation's data model and monitoring requirements, and only then promote it to your production Application Insights workspace.
- Download the latest DMF dashboard release from the FastTrack GitHub repository: DMF Accelerator Dashboard release DMF-1.1.0.0. Download the JSON asset attached to the release (
D365FSCM-Monitoring-Dashboard-DMF-v1.1.0.0.json) — do not use the automatically attached source archives.

- Save the downloaded
D365FSCM-Monitoring-Dashboard-DMF-v1.1.0.0.json file locally. - In Azure Data Explorer dashboards, choose New dashboard → Import dashboard from file and select the JSON file.
- Name the dashboard appropriately, then open the Data sources pane.
- In the Data sources pane, paste the Subscription ID that contains your Application Insights instance, then click Connect.
- You will get a list of databases. Select your Application Insights name from the list and save the changes.
- Your dashboard should now have data. Use the
environmentId, dataProject, entityName, executionId, and activityId parameters at the top of the dashboard to scope the view to a specific workload. Feel free to edit the queries to suit your needs.
Connecting Azure Data Explorer to your Application Insights instance
If you have not yet wired Application Insights into Azure Data Explorer, you will need:
- TENANT_ID — Microsoft Entra ID tenant where your Application Insights instance lives.
- SUBSCRIPTION_ID — the Azure subscription that contains the Application Insights instance.
- RESOURCE_GROUP — the resource group where the Application Insights instance is deployed.
- APPINSIGHTS_INSTANCE_NAME — the name of the Application Insights instance.
Enable export to Application Insights from your finance and operations environment, and (if you also want Dataverse signals on the same workspace) follow the Dataverse export to Application Insights guidance using the same instance for both.
A note on Azure cost
Please carefully consider the cost implications for Azure services when enabling the telemetry feed to Application Insights — DMF telemetry volume is proportional to the number of DMF jobs, entities and records you process, so high-throughput integrations can ramp ingestion charges quickly. For details and cost-control strategies (sampling, retention, daily caps), see Understand and control costs.
Conclusion
DMF telemetry, combined with Application Insights and Azure Data Explorer, gives you the visibility into data management executions that has been missing from the platform — start/stop times, per-entity throughput, error trends, and the ability to alert proactively rather than react to user-reported issues.
Please don't hesitate to share your feedback and ideas for the dashboard evolution using the post comments or by contacting us at D365AppInsights@microsoft.com.
In addition to the dashboard discussed in this blog post, there are several other sample dashboards available on the GitHub repository.
/* * SAMPLE CODE NOTICE * * THIS SAMPLE CODE IS MADE AVAILABLE AS IS. MICROSOFT MAKES NO WARRANTIES, WHETHER EXPRESS OR IMPLIED, * OF FITNESS FOR A PARTICULAR PURPOSE, OF ACCURACY OR COMPLETENESS OF RESPONSES, OF RESULTS, OR CONDITIONS OF MERCHANTABILITY. * THE ENTIRE RISK OF THE USE OR THE RESULTS FROM THE USE OF THIS SAMPLE CODE REMAINS WITH THE USER. * NO TECHNICAL SUPPORT IS PROVIDED. YOU MAY NOT DISTRIBUTE THIS CODE UNLESS YOU HAVE A LICENSE AGREEMENT WITH MICROSOFT THAT ALLOWS YOU TO DO SO. /


