Hi Salman51,
First of all, there is no region field in Opportunity entity, so you need to create this field first.
Go to Settings -> Customizations, enter Customize the System.

Go to Entity -> Opportunity -> Field, click New.
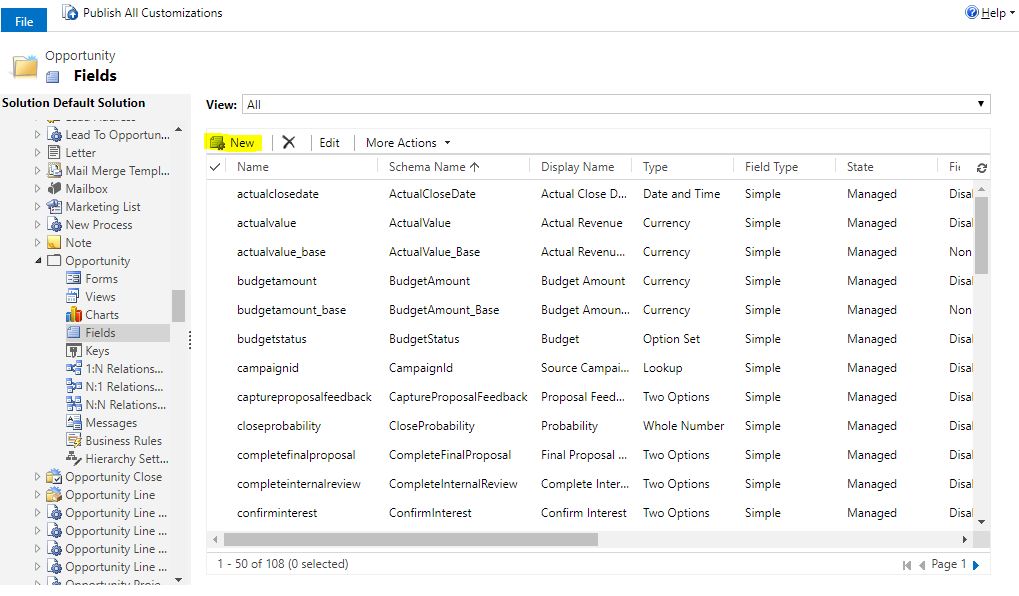
Enter Region in Display Name,
(For better results, you could select Option Set in Data Type and add all region names, this can limit the format of the name of the region entered by users.)
then click Save and Close.

Go to Opportunity -> Forms, double click to enter Opportunity.

Move Region field to Opportunity Information column.

Click Save and Close. Then click Publish All Customizations. The region field has been created and added to the form.
Go to Sales -> Opportunities, click Charts on the right. Then click "+" to add a new chart.

Enter the name, select Est.Revenue in Series, and Region in Category. You can also click on the button on the right side of Sum to select the chart type. Click ACTIONS -> Save.

This way the chart you need has been created.
Hope this helps.
Best Regards,
Lu Hao


